
Elipse Power optimizes Jirau HPP Operation with instantly generated charts and fluid screen browsing
Platform by Elipse Software allows retrieving instant trend charts at Jirau HPP in a more agile, intuitive browsing environment between screens, increases operational efficiency
Published on 04/15/2026

Needs
Jirau Energy is a Special Purpose Entity (SPE) whose shareholders are ENGIE Brasil S.A., Axia Energy S.A., and Mizha Shareholdings S.A., subsidiary of Mitsui & Co., Ltd. Under the legal auction number 005/2008, held by the Brazilian Federal Government in May 2008, the company was granted public use to implement Jirau Hydro Power Plant, on Madeira River, in Porto Velho (Rondônia state, north of Brazil), for a 35-year period of operation.
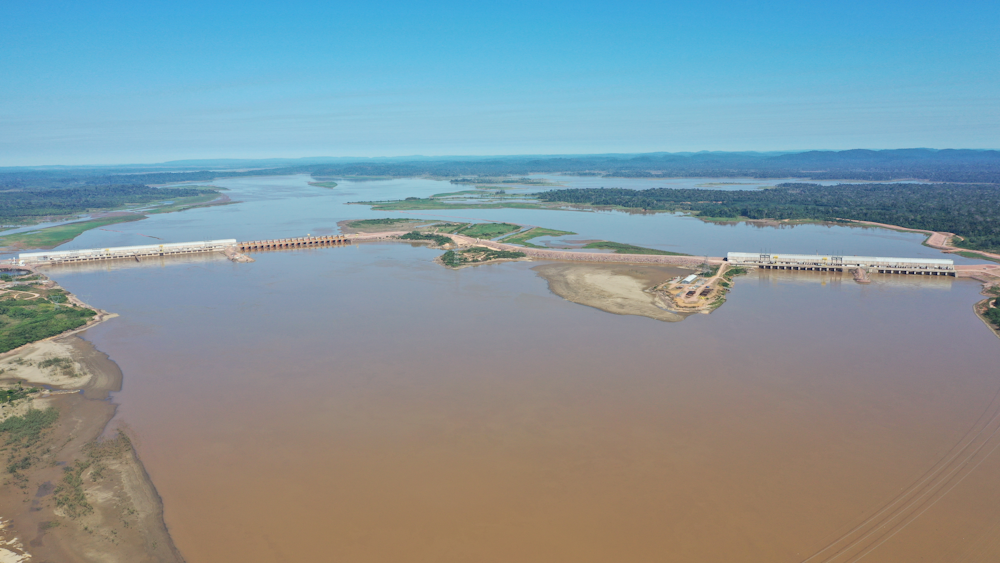
Since September/2013, Jirau HPP has generated up to 3,750 MW altogether. This represents 3.7% of all hydroelectric power in Brazil, and it is coming from the 4th largest plant in the country in terms of installed capacity. Its run-of-the-river reservoir and 50 bulb-type turbines make it one of the biggest plants in the world, turbine wise, which plays a crucial role in providing renewable energy to over 40 million Brazilians.
For a more reliable, safe, efficient plant control, Jirau Energy has decided to adopt Elipse Power. Developed by Elipse Software, the global software developer of real-time and remote process management solutions, the platform is compatible with all versions of Windows, providing fast, readily accessible support. Therefore, whenever Microsoft releases a new version fixing vulnerabilities and bugs of any kind, the stations can be updated promptly.
Elipse Power’s seamless browsing between screens is a key factor in providing Jirau Energy with fast access to information about the plant. The software’s modern interface, where data is displayed in an orderly visual arrangement, allows operators to read it more clearly, with fewer mistakes.
Another selling point for Elipse Power in this project is its ability to generate charts instantly when integrated with two other Elipse Software’s platform: Elipse Plant Manager and Elipse TrendExplorer. Additionally, it interacts with several other drivers (108 in this application), which facilitated its implementation in the plant by the solution provider Automa Power & Utilities S.A., a company that specializes in developing and installing digital solutions for transforming the future of energy.
Solution
Jirau HPP’s automation system is operated via a control room and two local rooms, each located in the powerhouses on the plant’s right and left riverbanks. The local rooms work as a Hot Standby application, with the one on the right being the HOT one, and the one on the left, the STANDBY one. Meanwhile, the control room features an application installed in a high availability cluster. Both applications are identical and connect directly with AKs and protection relays via IEC60870-104 and IEC61850 drivers, in addition to SNMP to monitor the networks.
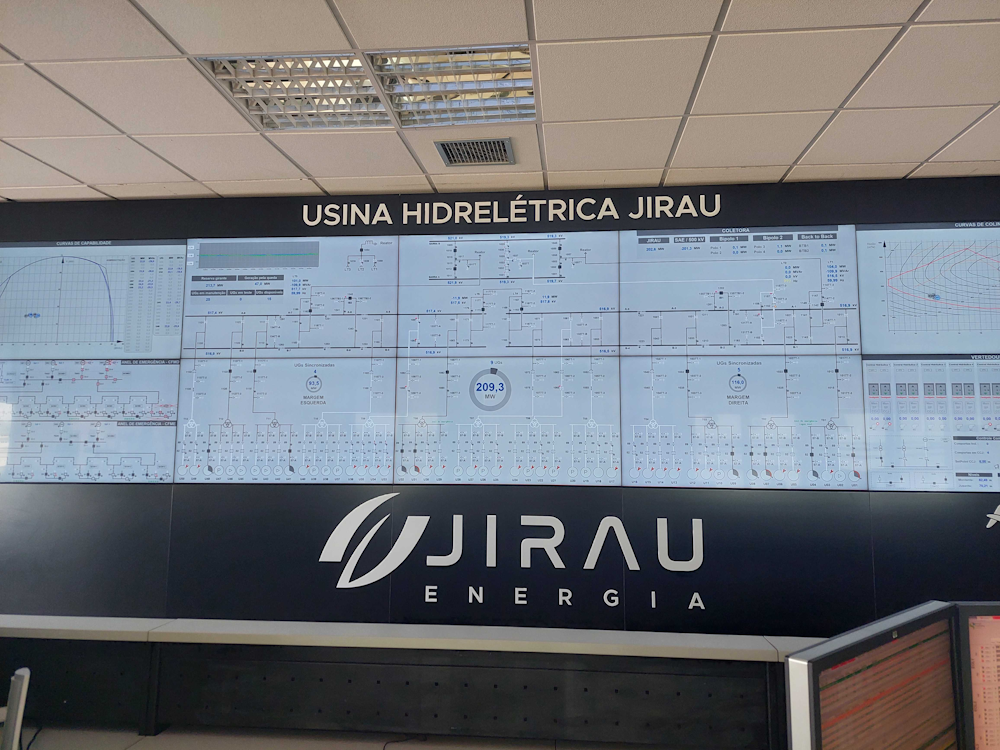
The application’s screens were developed for high performance, in shades of gray, so that abnormalities in red will easily catch the eye, calling attention to essential information. As for single-line diagrams, white means “deenergized”, and dark gray is “energized”; therefore, operators can easily spot the sections with electric voltage, which will facilitate the visualization of the system’s status as a whole and all its ongoing maneuvers.
To optimize control and guarantee a clean layout for operation regardless of the plant’s massive size, Elipse Power allows controlling each of its 50 generating units (GUs) separately. The GU’s electric single-line diagram, its own power, and the power of its neighboring GUs, are all displayed at the center of each GU’s control screen, as well as their connection to switches, transformers, and substation. Voltage and speed regulators can also be controlled from the center of the screen.
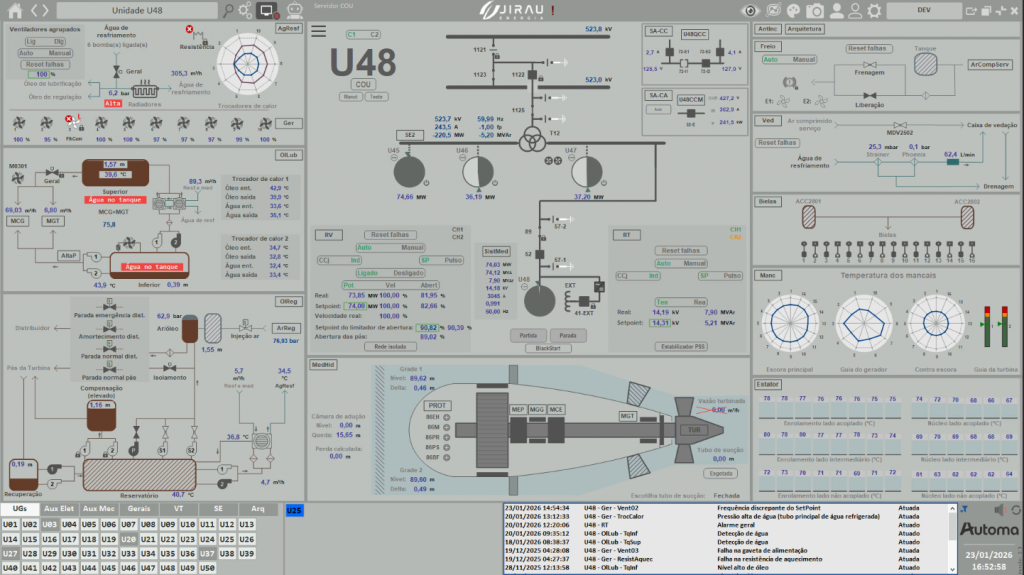
Right below, Elipse Power allows monitoring the water levels of the GU’s turbine and the delta, that is, the load loss due to the accumulation of debris on the protective grid. Also monitored in this section of the screen is the turbines outflow. To the left, the software displays the mechanical undocking aids and subsystems used to activate the GU, sorted out by start order to facilitate visualizing the automation.
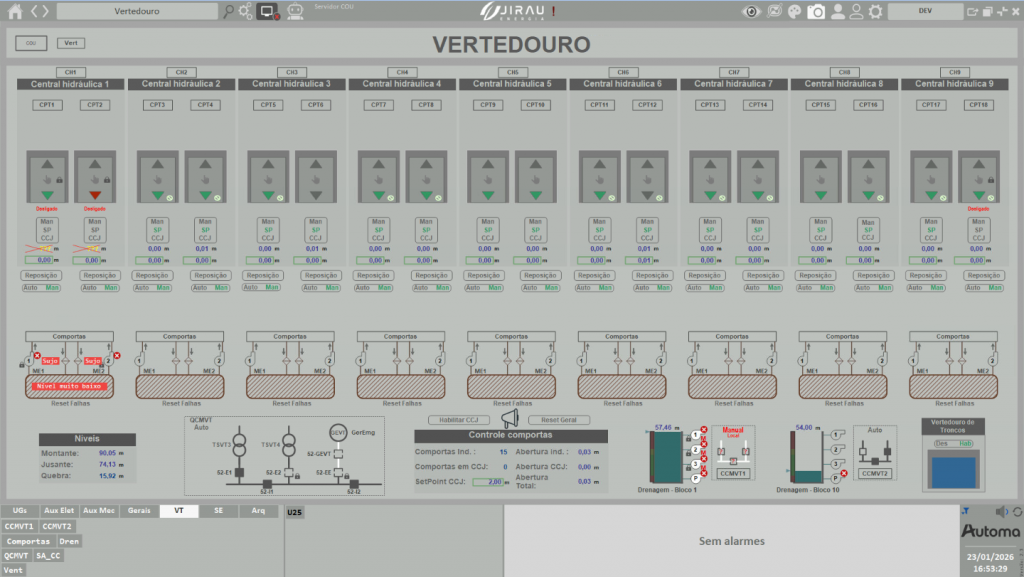
On the right side of the screen, operators can monitor temperature of bearings and stators to keep them from overheating. They can also oversee the turbines’ connecting rods, as well as brake and sealing systems, to regulate their water flow. Additionally, there is another screen dedicated to controlling the spillway; it allows opening and closing all 18 floodgates in the plant manually, via setpoint actions or joint control mode, with the same opening value being used for more than one floodgate.
The same screen also allows monitoring the pressure of the hydraulic centers’ pumps and filters for each floodgate (two). Through the pressure generated by the pumps, the hydraulic system is able to open and close floodgates. Elipse Power can also monitor upstream, downstream, and water catchment levels. Additionally, its screens display customized footers that indicate alarms related to generating units, ancillary services, or the substation.
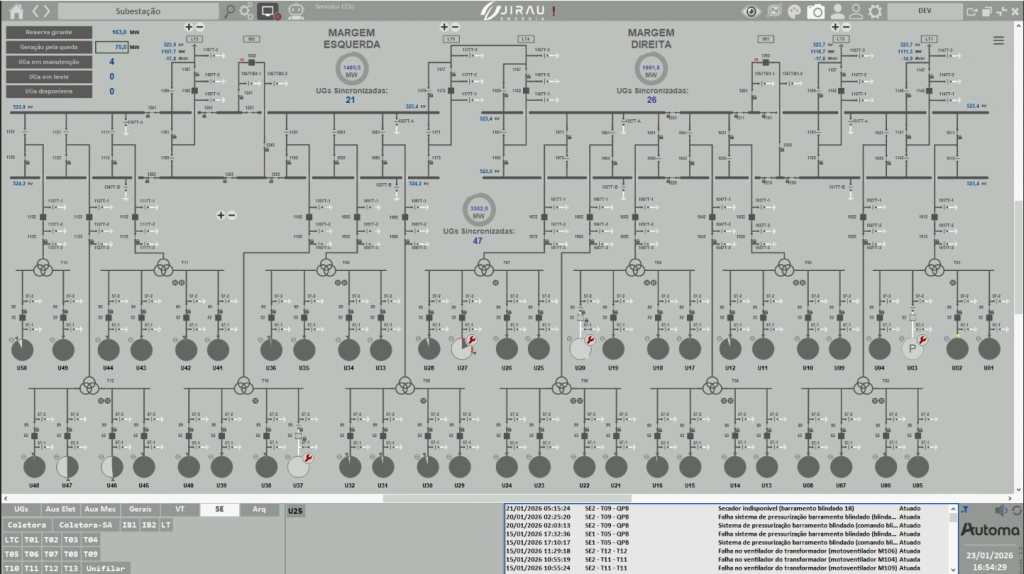
The next Elipse Power screen details the substation’s electric single-line diagrams, which monitor the plant’s GUs status (test mode, maintenance, or available), in addition to the voltage in buses and lines. It allows checking the energy being generated altogether by the plant and its GUs, located on the east and west riverbanks, and whether they are synchronized. Finally, it displays the full generating capacity for each GU (75 MW) and the extra generating capacity that is available by increasing the power output of generators that are already connected to the power system (spinning reserve).
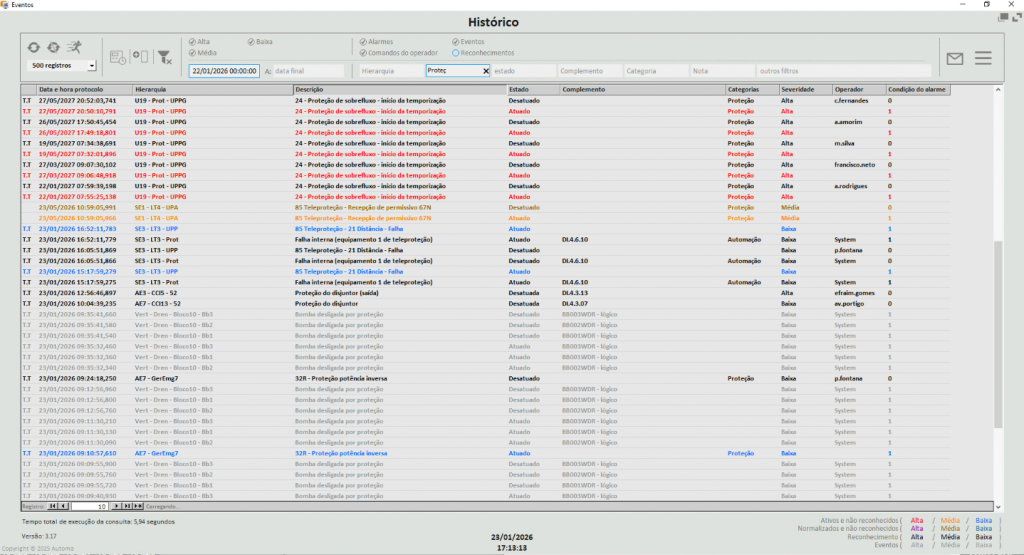
The history screen displays details regarding alarms and events flagged at the plant, and it allows filtering the search by period, device, and other items chosen by the operator. To indicate alarms severity, the software uses the following colors: red = high; yellow = medium, and blue = low. It also features an exclusive alarms screen subdivided into priority levels, which highlights errors that require immediate action. Texts pertaining to the events are displayed in gray.
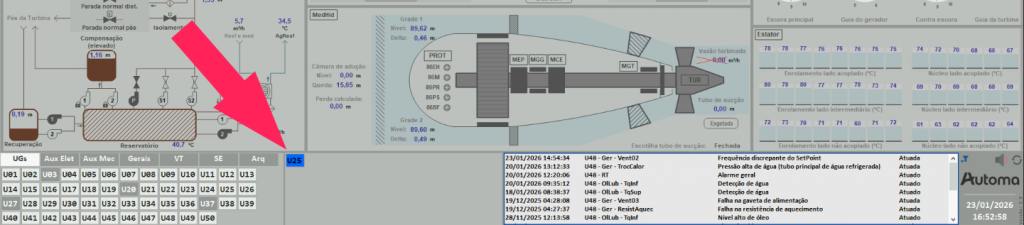
The application also allows exporting and printing the history either in PDF or CSV formats; messages can be sent to the development team to submit comments and to suggest solutions or new ideas. To reinforce and streamline the inspection of incidents in the plant, flagged alarms are described briefly, from more to less recent, on the footer of Elipse Power screens. To the left of the alarms, there is another box displaying buttons to access each GU and other monitored sections of the plant. By clicking one of them, the operator will open the screen that controls the desired sector or machine.
If an alarm fires at another area in the plant (not the one being monitored), the access button for this area will pop up on the footer, signaling its severity and indicating the initials of the sector. This way, the operator will be able to access the correct screen and solve the issue at hand more quickly. The Elipse Power templates were employed to standardize all the data regarding alarms and events, in order to maintain the visual identity throughout the project.
Lastly, the application integrates Elipse Power with Microsoft Teams to display the last 30 alarm signals that oscillated the most in the past 24 hours, so that the maintenance team can quickly spot both physical (sensors) and logical fails via Teams even when working remotely.
Benefits
To Fabio Hugo Souza Matos, Jirau Energia’s Real-Time Operation Coordinator, the implementation of a more modern supervisory and control solution has improved the team’s morale by reducing the impact in the operational routine, which provides more agility for data collection, processing, and analysis. According to him, Elipse Power has raised the whole operation to a new level of excellency by improving workflow and adopting a more versatile approach, better aligned to the specific demands of the plant.
“The performance gain reflects directly on the response quality to ONS (National Electric System Operator). More precise information returns and faster command execution make for a safer, more efficient operation, mitigating operational risks and reinforcing reliability for the National Interconnected System (SIN),” says Matos.
Among the main benefits brought to Jirau Energia by Elipse Power, we highlight the following:
- Operational Efficiency:
-
- The template-based application architecture has allowed standardizing screens in all 50 Generation Units, maintaining the same visual identity throughout all systems.
- The whole project can be visualized more easily, up to 16 screens at a time, which allows consolidating information and shortening browsing time.
- High-Performance HMI:
-
- Information is displayed in shades of gray, so that abnormalities (in red) are visualized more quickly.
- Users now make their decisions with less eyestrain and more confidence.
- Analytic Performance:
-
- Integration with Elipse Plant Manager results in instant trend charts generation, which facilitates the search and analysis of information.
- Agility in Contingencies:
-
- The transition between operation environments (control room/local rooms) has become quicker, more assertive.
- Unlike the previous dynamic, which was segregated, the new system provides a fluid, secure response at moments of high operational complexity. Users can now control the plant from any room.
- Cybersecurity:
-
- Migration to a modern infrastructure (Windows Server 2022) guarantees more protection against vulnerabilities and continuous support from Microsoft.
- A more robust database increases the plant’s systemic reliability and cyber security.
Datasheet
- Client
- Jirau Energia S.A.
- Solution provider
- Automa Power & Utilities S.A.
- Elipse products
- Elipse Power, Elipse Plant Manager, and Elipse TrendExplorer
- Platform
- Windows Server 2022 Standard
- Number of copies
- 3
- Number of I/O points
- 140.000
- Drivers
- 108 altogether (89 drivers communicating with IEC60870-104 protocol + 14 with IEC61850 + 5 with SNMP)
- Sector
- Electric Power
