Elipse E3 monitors and controls stations of the São Paulo subway – Line 4 (Yellow)
Elipse E3 allows to monitor and execute commands in different sectors, devices and subsystems in Luz, República, Paulista, Faria Lima, Pinheiros, Fradique Coutinho and Butantã substations

Needs
With the objective of automating seven subway stations in Sao Paulo, ALSTOM Transport, a company that offers products and services for rail operators, has decided to implement E3, the solution for monitoring and controlling processes developed by Elipse Software. The idea was to apply a system to monitor and execute commands in many different sectors, devices and subsystems in Luz, República, Paulista, Faria Lima, Pinheiros, Fradique Coutinho and Butantã substations.
To carry out this project, ALSTOM has worked alongside Plantech Engineering and Systems, the company responsible for implementing the software. Altogether, 51 copies of E3 were purchased: 10 MasterPack 5,000 Suites, two MasterPack 10,000 Suites, and 39 Viewers Control.
Solution
The system control station comprises two E3 servers connected to two HMI (Human Machine Interface) servers that collect and display information stored in the PLC (Programmable Logic Controller) on four monitors. These servers run in Hot-Standby, being one of them a stand-by server that is activated whenever there is any kind of failure in the main server.
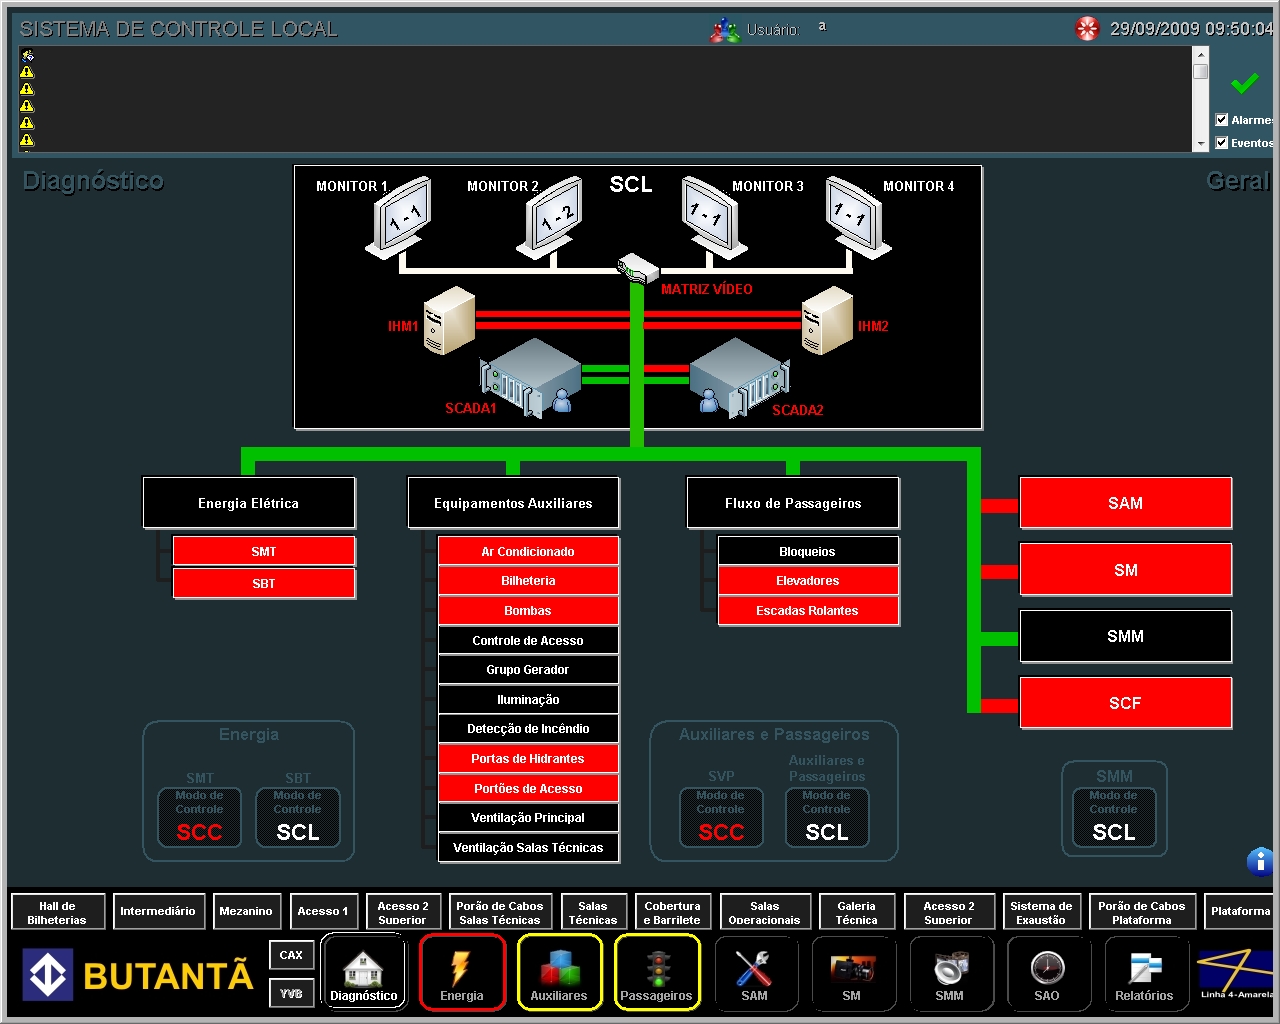 Figure 1. General Diagnostics Screen
The diagnostics screen allows the overall direct navigation in all subsystems controlled by the LCS (Local Control System). On top, the basic architecture is displayed with E3 servers, HMI, and video monitors. Below, the subsystems are displayed in tree mode.
Alarm Manager
Placed above the screens, the alarm manager is a field where both old and active events are listed. There, the operator has access to date, time, location and severity of the problem (blank = alarm acknowledged, red = severe, yellow = blinking between red and yellow).
From this screen, the operator can also view details about any of the events verified by the alarm system. To do so, just click the Acknowledgment option (symbolized the green “check” sign) after selecting the row corresponding to the event you want to monitor.
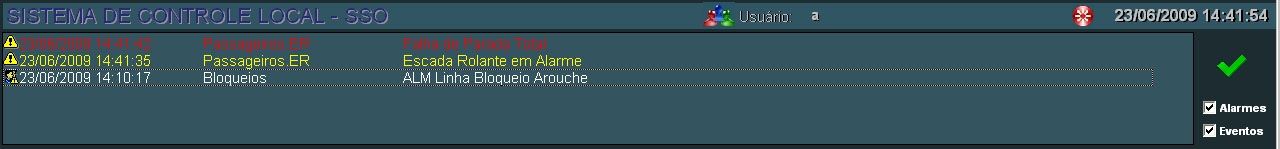
Figure 2. Alarm Manager
Subsystem Icons
Located at the lower edge of the screens, icons are an option for easier navigation between subsystems. Above them, there is a bar that allows quick access to areas with smoke detector system. Both have an alarm system, where the coloring of the edges determines the severity of the event (red = severe, yellow = light, and blinking = both).
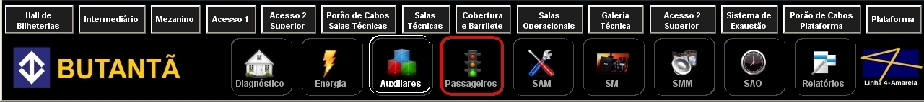 Figure 3. Bottom bar on system’s main screen, containing the icons and buttons with fire detector system
Switching between monitors
Each HMI server has two video monitors, and altogether there are four. Through the LCS, you can choose the images to be displayed in each monitor. To do so, just click VIDEO MATRIX and make a desired selection. Thus, the operator can control four different screens simultaneously.
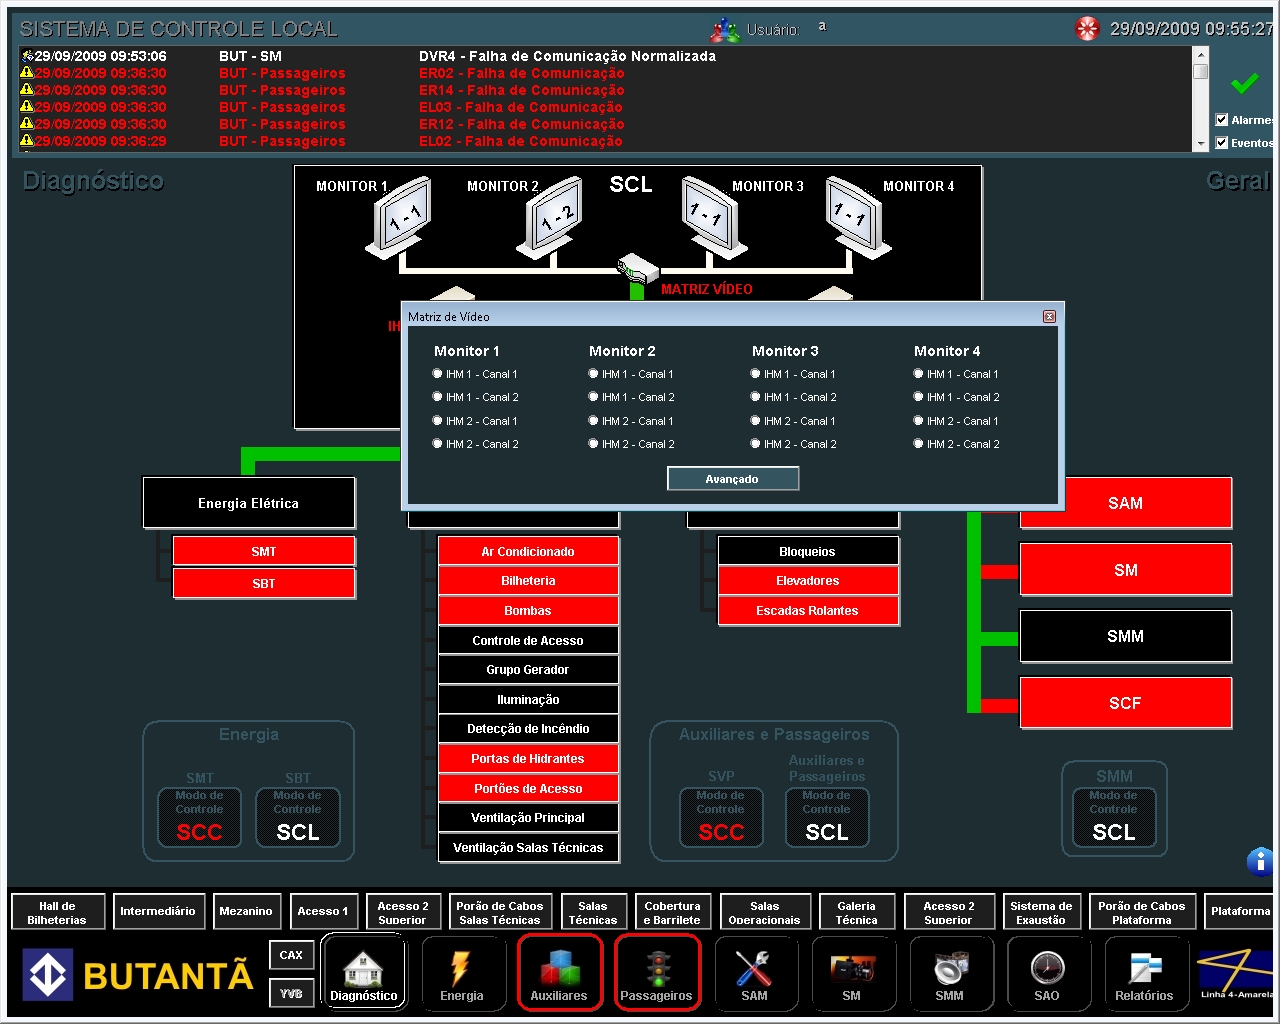
Figure 4. Switching monitors Electricity
Electricity
E3 allows operators to control the complete electrical systems of the seven stations being monitored in São Paulo. By clicking the Electric Energy icon, the General unifilar is displayed, divided into SAV (System Average Voltage) and SLV (System Low Voltage).
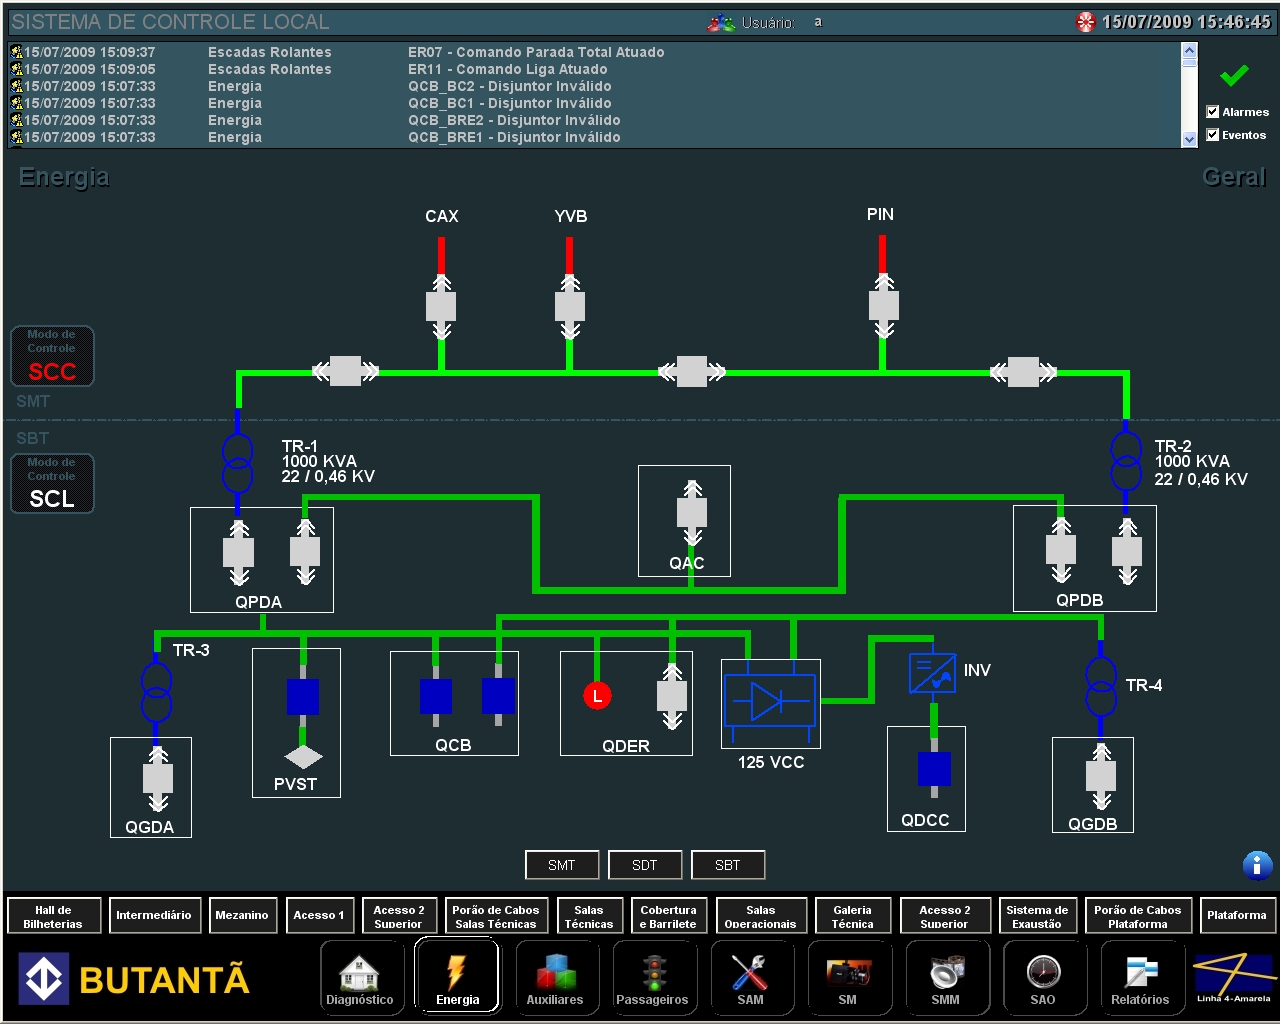
Figure 5. Screen displaying the electric network’s medium and low voltage systems
On this screen, the operator can see if a breaker is open (green), closed (red), blocked, extracted, or failed, allowing them to perform commands for opening or closing keys. The same procedure applies to the case of disconnect switches or contactors.
The measurements captured by transformers, diode rectifiers and inverters are also monitored by the system, as well as the energizing of the bars that connect each device on the electrical mesh (green bar = de-energized, red = high). To view them, just click the picture that represents the object being monitored.
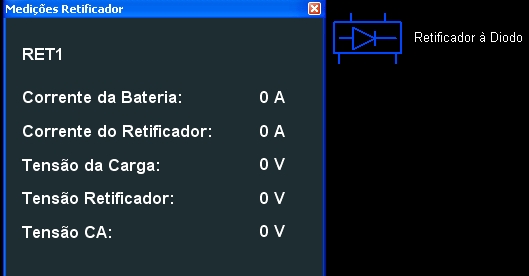
Figure 6. Screen displaying the measurements captured by one of the diode rectifiers
Auxiliary Devices
By clicking Auxiliary Devices, the operator is able to control the complete air conditioning system, box office, water pumps, lighting, fire and intrusion detection, fire hydrants, main ventilation and technical rooms.
Air Conditioning
The system allows the operators to turn the air conditioning units on or off, set them in manual or automatic modules, turn fans and compressors on or off, , or trigger the backup air conditioner.
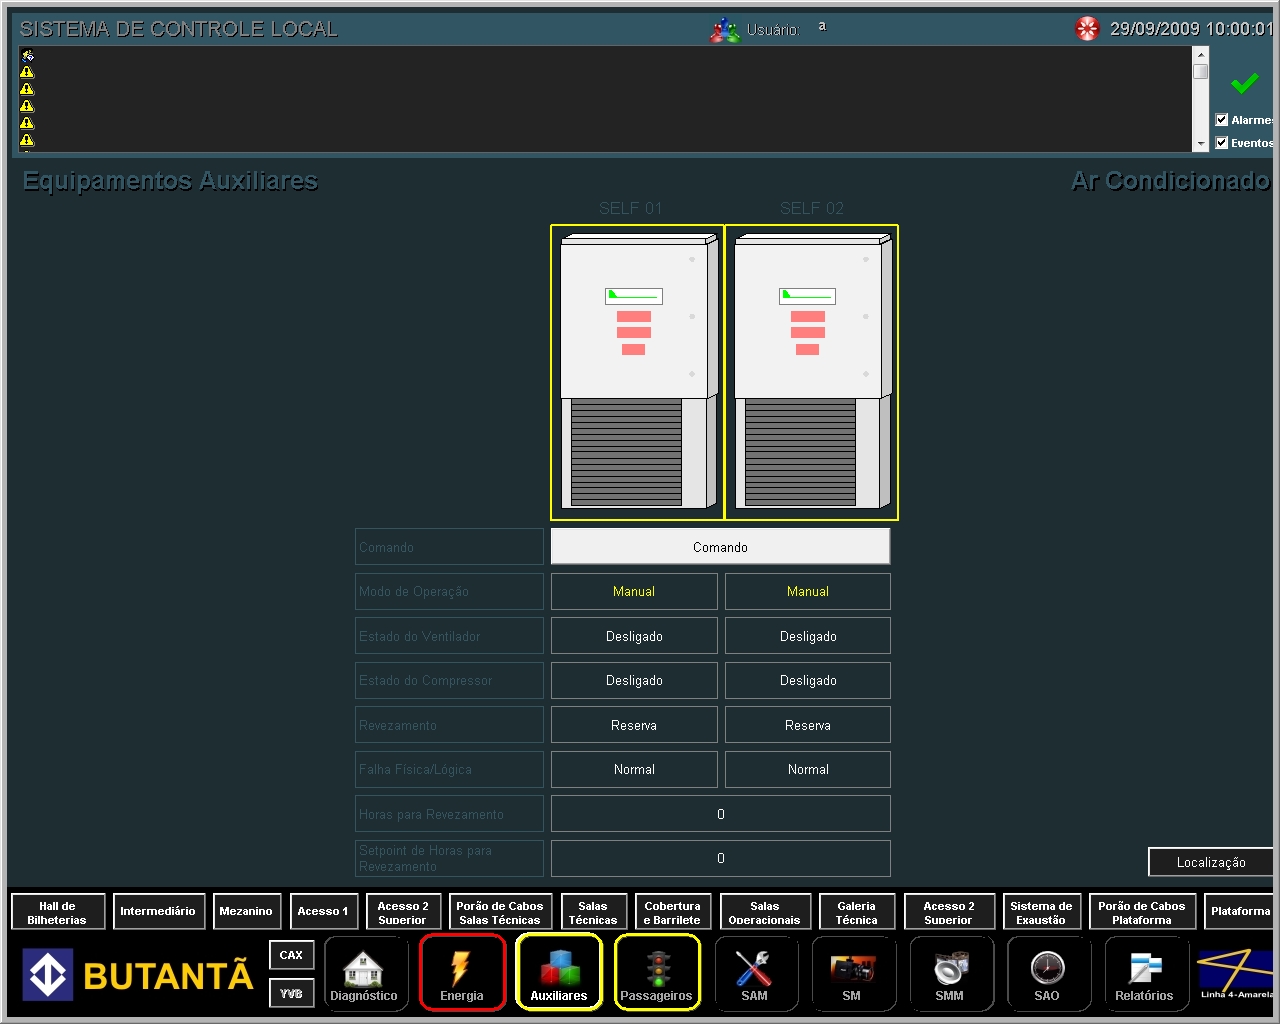
Figure 7. Air conditioning screen
Ticket Office
The ticket office is also controlled by E3. Through the system, it is possible to monitor the vaults, and also perform commands for opening or closing. In addition, the system also has a burglar alarm.
Pumps
Through the system, you can monitor the amount of water stored within the four existing pumps at the stations, from drinking water to water coming from the rain and sewage. In case of fire, the operator is able to map the region where there was the occurrence and redirect the water stored inside the pump intake to the hydrant near the site.
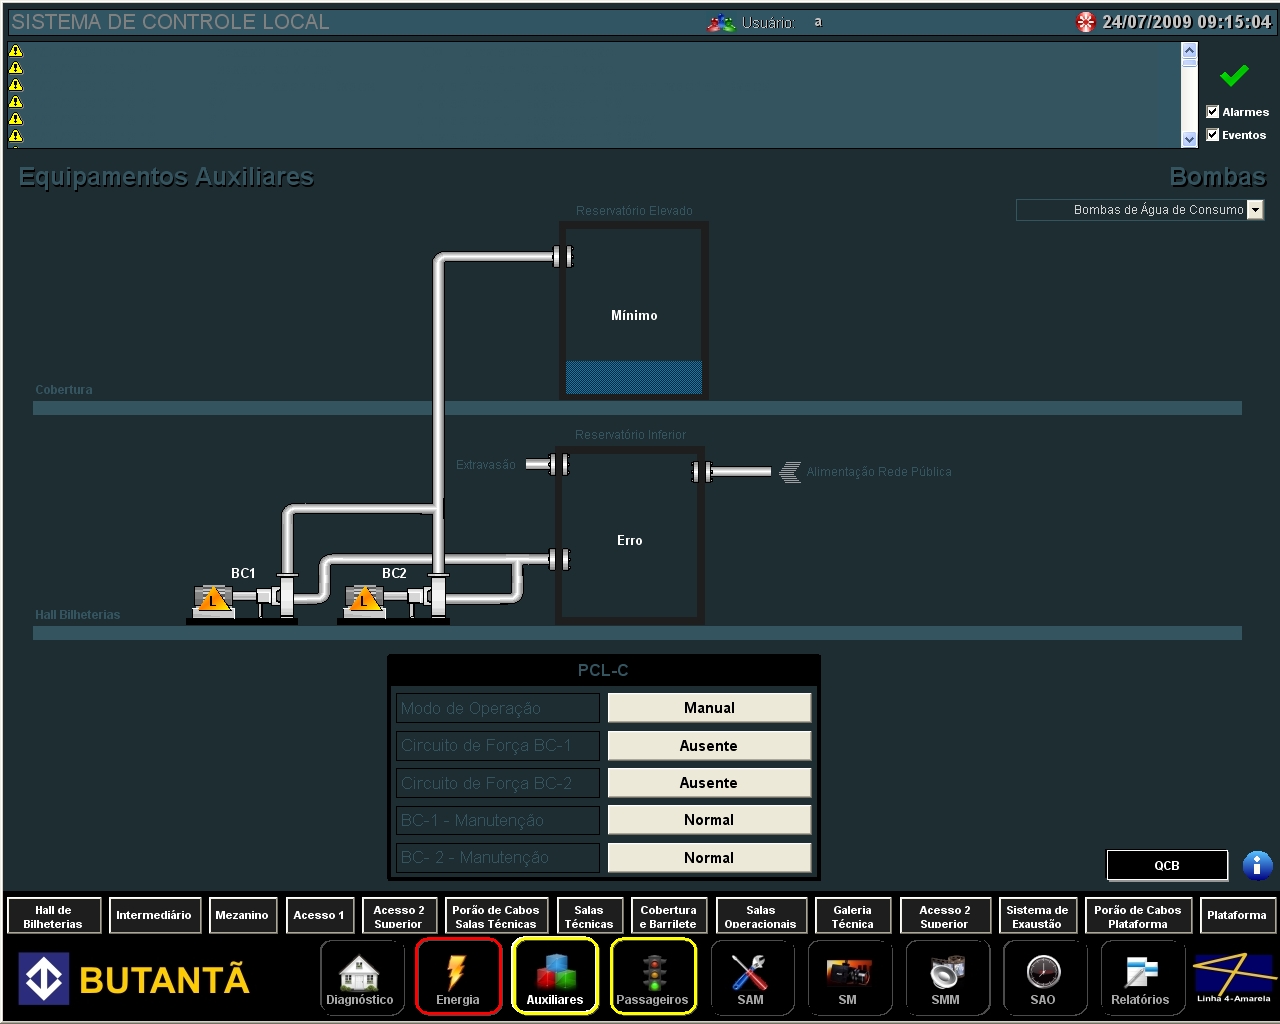
Figure 8. Pumps, water consumption
Lighting
Altogether, the system has eight panels that let you control all internal lighting of the stations that make up the yellow line.
Fire Detection
It is a 14-bar screen, each bar representing one of the different sectors of the line. From the moment an alarm is generated, the bar corresponding to the affected area blinks red in case of alarm, or yellow, to indicate system failure. By clicking the button in focus, a new screen will open with more detailed representation of the alarm condition or failure.
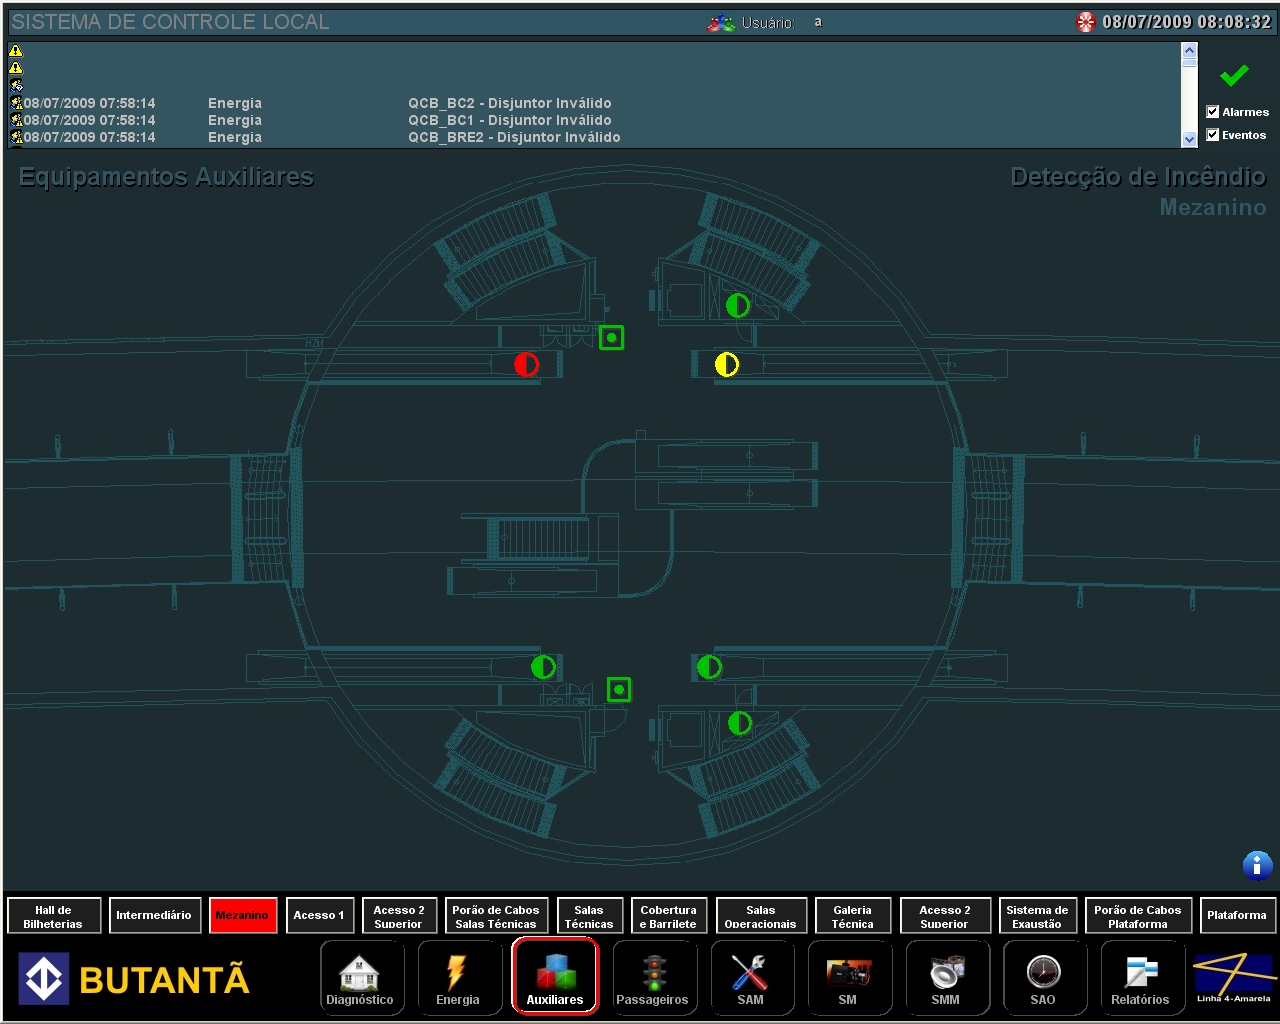
Figure 9. Fire detection alarm on the mezzanine level (red arrow) and failure (yellow arrow)
Hydrants and Access Doors
Through the system, you can locate and view the conditions of each hydrant in the subway line, where green means normal and red means fire alarm situation. In addition to controlling the fire hydrants, the system also allows you to run commands for opening and closing all access gates.
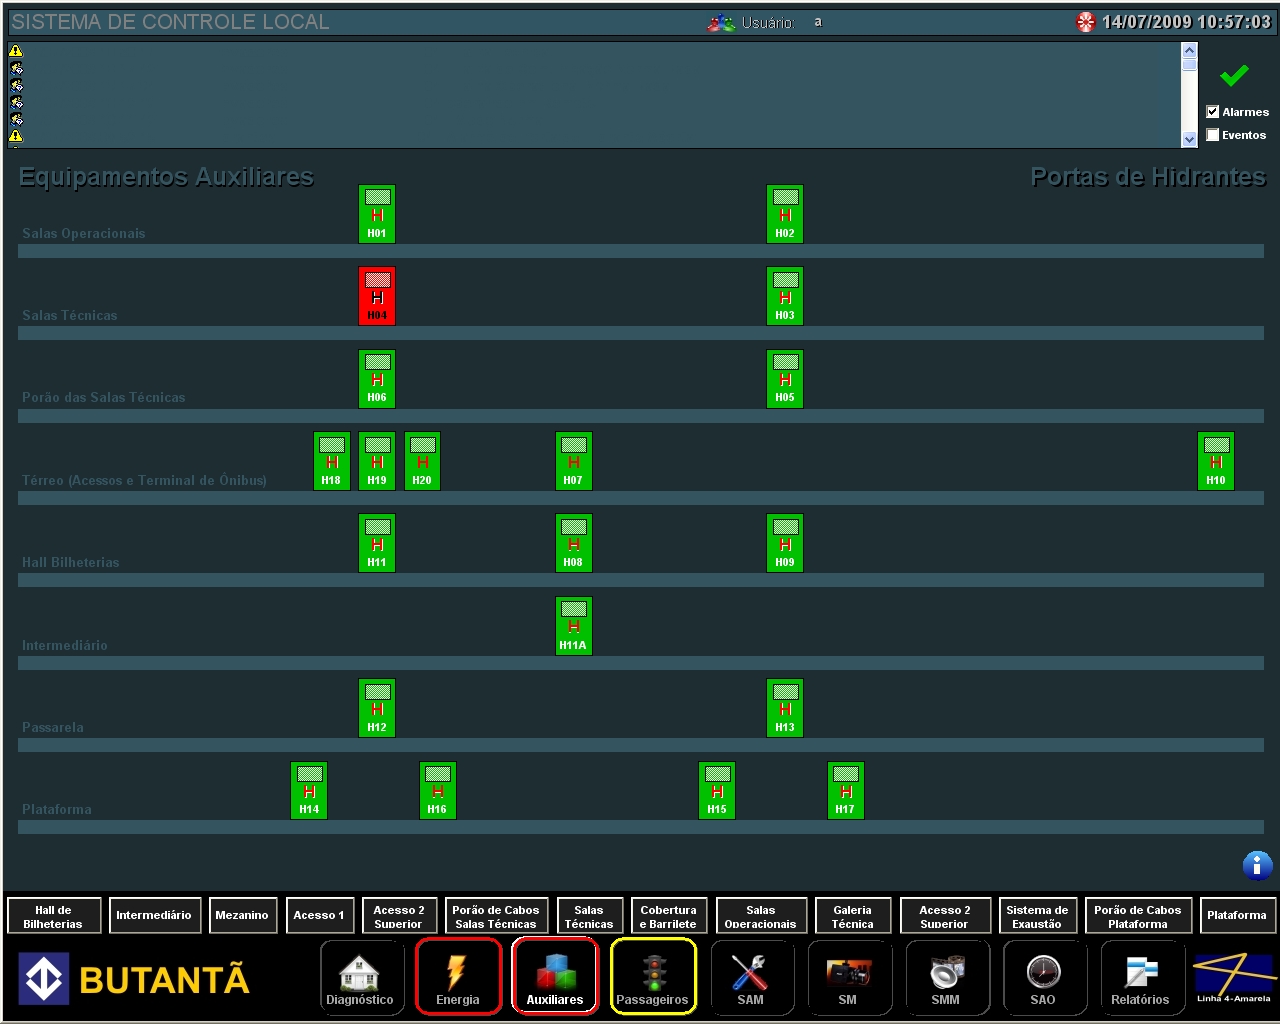
Figure 10. Screen viewing of the fire hydrants in alarm situation
Passengers Flow
Screen that displays the Ticket Office Hall, enabling block control (turnstiles), elevators, escalators and conveyor belts.
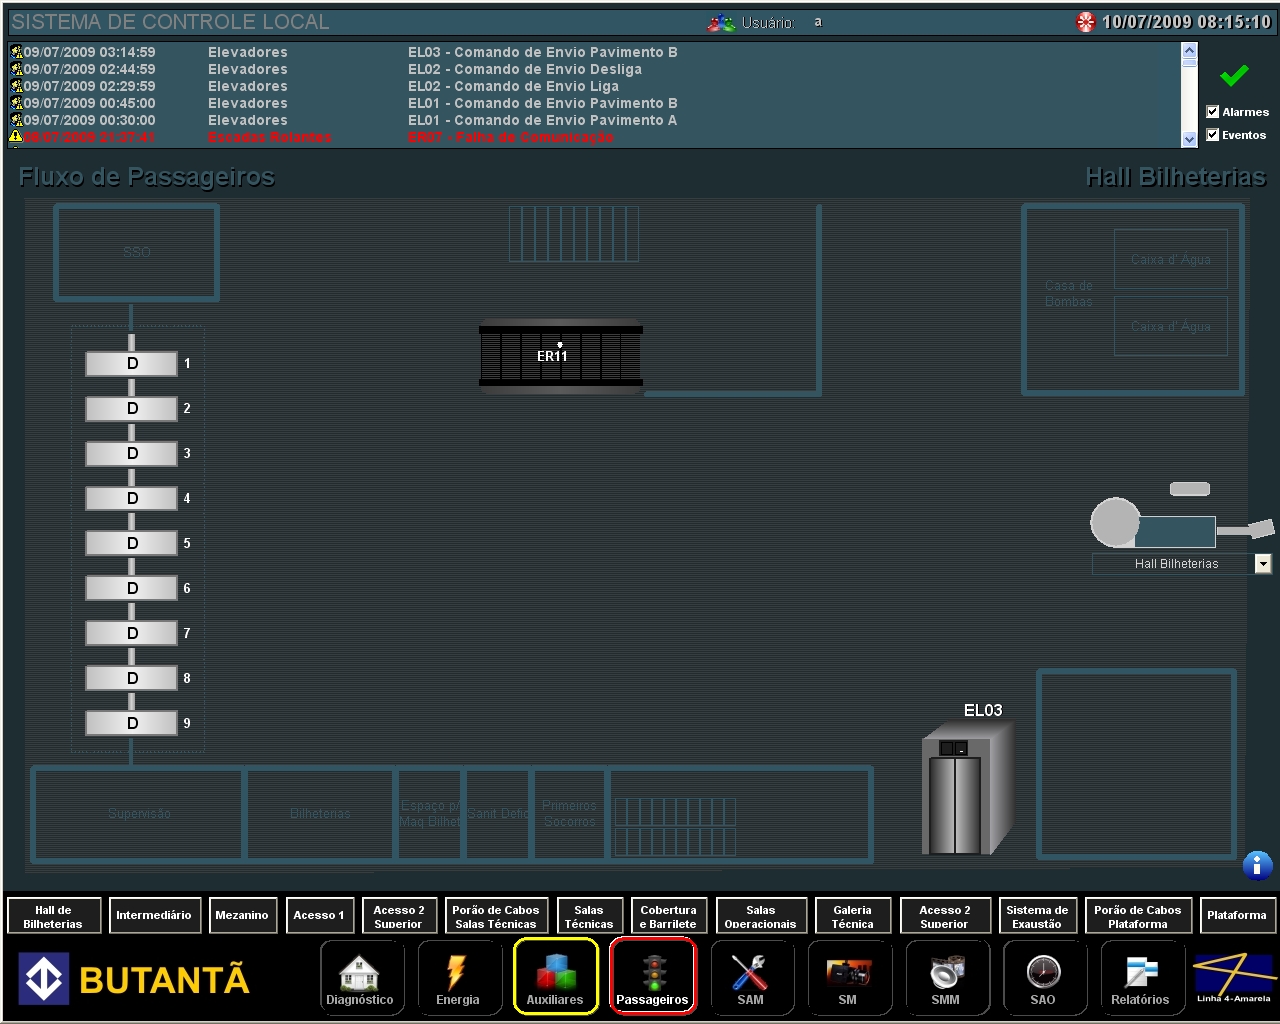
Figure 11. View of the ticket hall
Maintenance Support System (MSS)
Screen where the reports generated by E3 are displayed. They can also be filtered by date, time, stop and failure. The system allows the operator to print and save reports in PDF or XLS.
Monitoring System
Allows access to all geographical screens in the system. By clicking Platform, a screen showing the cameras found on the site is displayed. By clicking on one of them, either the fixed one or mobile, the operator can view the picture in full screen, original size, send the image, set the view or close. Remember that theSend image and Set view options are only available in full screen. Altogether, it is possible to operate up to nine cameras simultaneously, with zoom and camera moves.
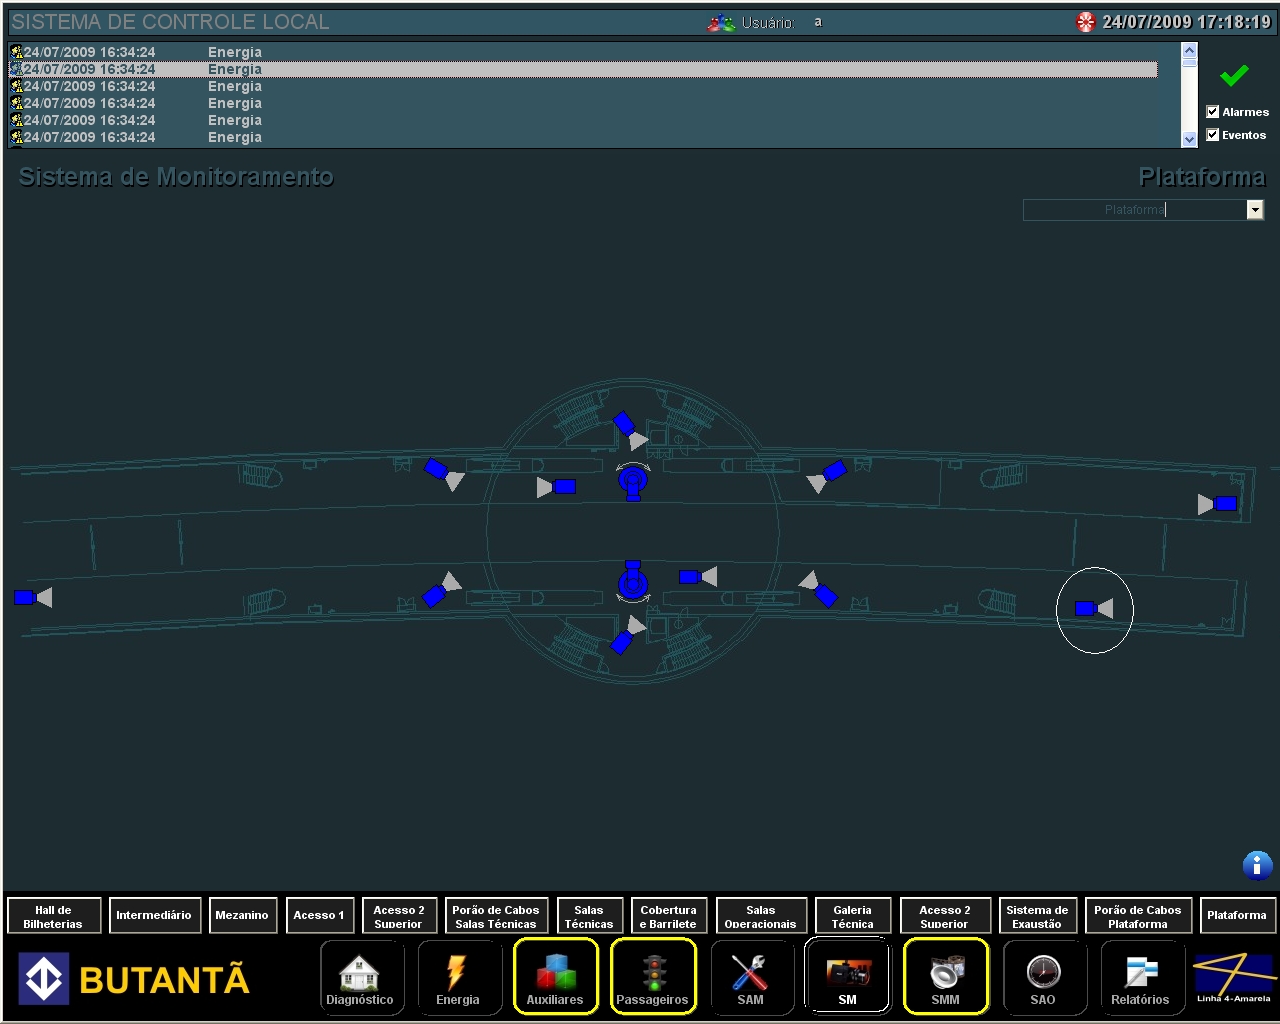
Figure 12. Viewing platform with cameras
Multimedia System (MMS)
Feature that allows sending voice and data messages to different environments of subway stations monitored by E3.
Operational Automatism System (OAS)
System for creating time-based or cause-based operational routines, or even both. With the screen management system, you can add, remove or edit routines.
Alarms / Events Manager Report
Option to access the alarms report screen. It displays the history of alarms occurring over time, which can be filtered for certain intervals of time, place, subsystem and severity. With it, the operator can also print and save reports in PDF or XLS format.
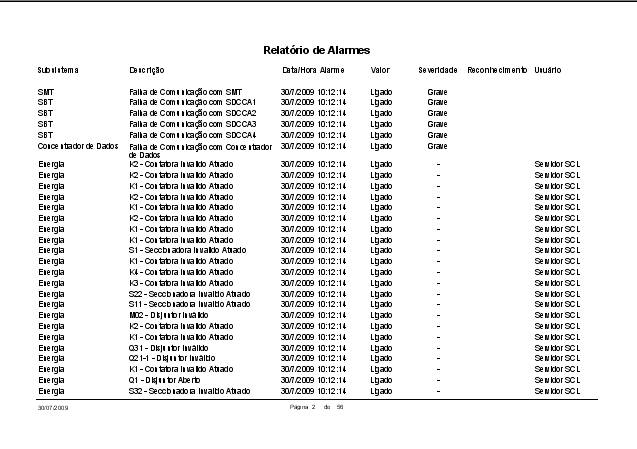
Figure 13. Report’s print screen
Benefits
- Fast detection of incidents, fires and equipment failures via a complete alarm system.
- Monitoring and control of the line’s complete electrical system (circuit breakers, disconnectors, contactors, inverters, converters and diode rectifiers).
- Control of the entire flow of passengers, elevators, escalators, air conditioning and access gates.
- Control of drinking water pumps, fire, storm water and sewage pumping.
- Control of the line’s power system.
- Monitoring and control of ticket offices and vaults.
- Possibility of creating operational routines in the system.
- Alarms easily manageable, thus making it possible to edit the system to display the events according to the criteria of time, place, subsystem or severity.
- Reports can be saved and printed in PDF or XLS format.
- Easy handling and configuration of cameras monitoring.
Datasheet
Client: ALSTOM Transport
Systems Integrator: G4S Engenharia e Sistemas
Software : Elipse E3
Number of copies: 51
Platforms: Microsoft Windows Server 2008 e Microsoft Windows Vista Business
Number of I/O points: 105 mil
I/O Drivers: Alnet TCP, Alnet I, Modbus TCP, SNMP, MProt, ASCII, Ping, Pelco DX8100 e Digicon SCAP e SCA
