Elipse Software’s platforms optimize decision making for CCR Group in Bahia
CCR group, one of Latin America’s largest infrastructure concession companies, uses Elipse E3, Elipse Power, and Elipse Plant Manager to automate and maintain equipment and subsystems in metro stations and bus terminals at Salvador and Lauro de Freitas Metro System (SMSL)
Published at 03/06/2023

Needs
CCR Metrô Bahia is a subsidiary of CCR Group, one of the largest infrastructure concession companies in Latin America. Since 2013, the concessionary has been responsible for maintaining and operating one of the largest metro systems in Brazil: the system comprising the metro stations and bus terminals that connect Salvador, capital city of Bahia in the Brazilian northeast, to Lauro de Freitas, municipality in the metropolitan area of Salvador.
In order to automate and integrate the several devices and subsystems that compose the system, CCR has chosen Automind as their solution provider, and the products by Elipse Software (Elipse E3, Elipse Power and Elipse Plant Manager) as their monitoring and control tools.
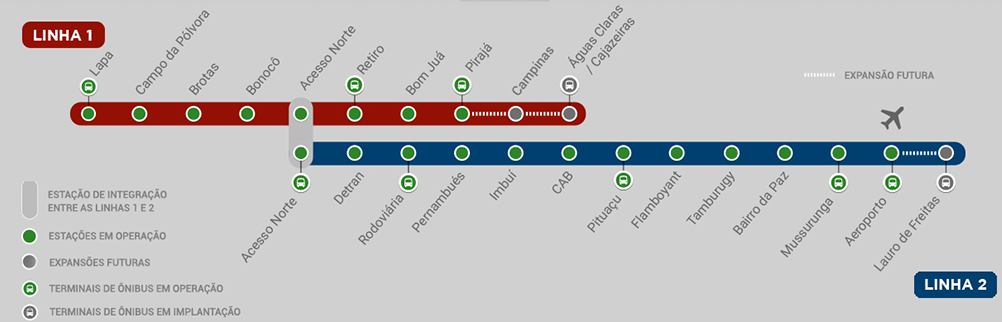
Figure 1 – Metro system connecting Salvador to Lauro de Freitas
Solution
The automation system installed in Salvador features a modern Operations Control Center (OCC), where it’s possible to manage all subsystems remotely. Additionally, all metro stations and bus terminals have their own Operations Supervision Room (OSR) with Metrô Bahia Control System installed.
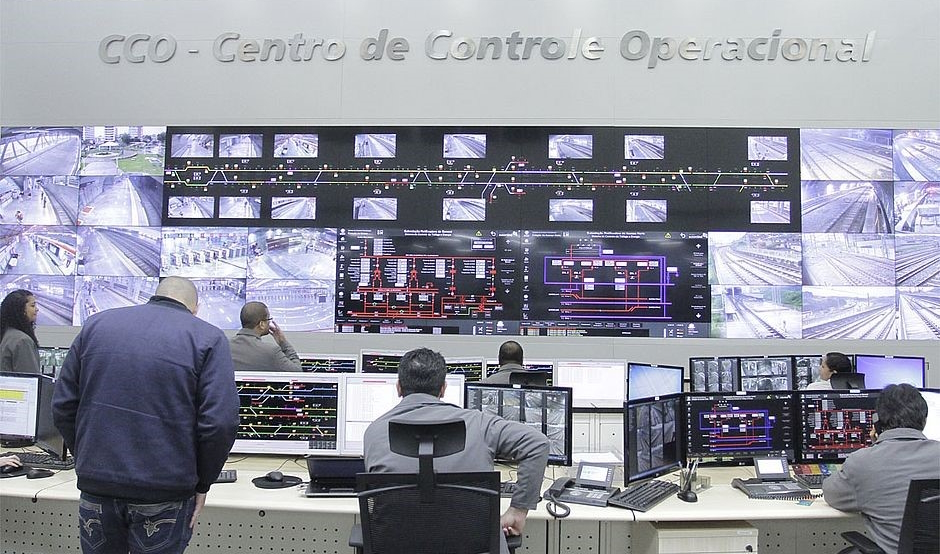
Figure 2 – Main Operations Control Center (OCC)
This control system comprises SCADA servers and clients distributed along all metro stations, each with a pair of redundant Hot-Standby servers that are responsible for integrating the equipment and other subsystems. The architecture also features two control centers (main and backup), each with two redundant Hot-Standby servers, which retrieve the data needed for the operation via the servers in the metro stations.
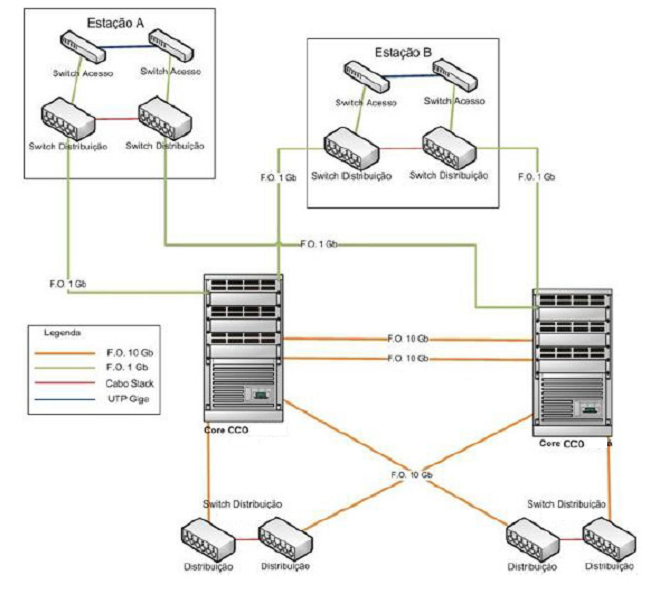
Figure 3 – System’s architecture
Once the SCADA system is initialized at the OSR, the diagnosis screen pops up. Through it, it’s possible to check for communication errors with servers, screens, and switches, as well as to access all screens and functionalities in the system. Notice that some of the OSRs work with Elipse E3, while others run on Elipse Power: these two Elipse platforms help CCR control and monitor its various devices and subsystems.
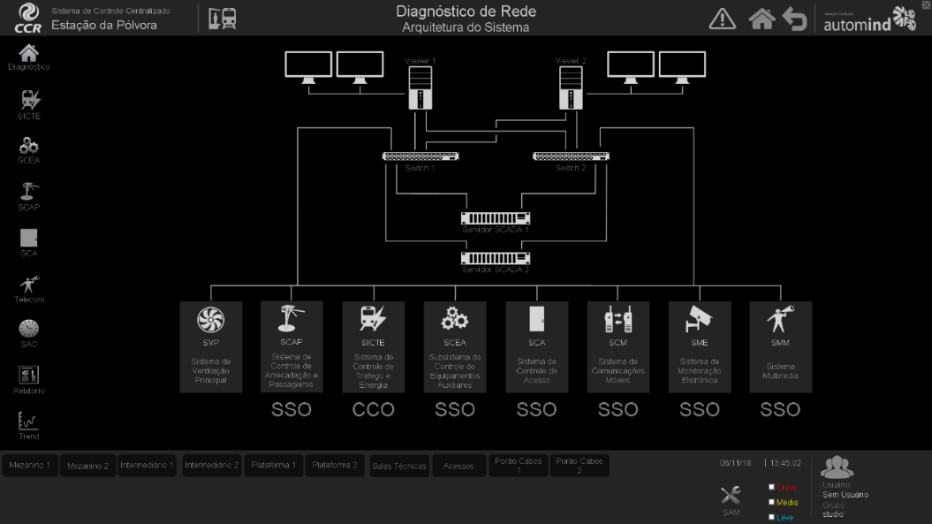
Figure 4 – OSR´s initial screen – Network diagnosis
The OCC’s initial screen displays other functions in addition to the ones listed above. With it, it’s possible to access applications in all OSRs and to monitor the system’s servers by checking network assets and working the remote domain, a module that allows acquiring data from servers in other stations.
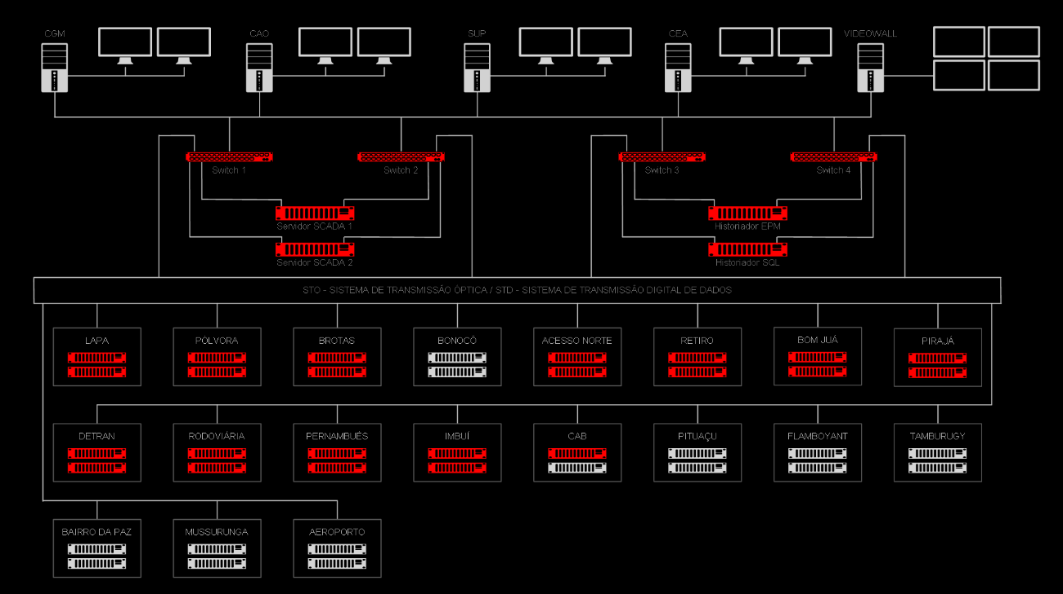
Figure 5 – OCC’s initial screen – Network diagnosis
Communication Interfaces’ Diagnosis
When there is a communication failure between the SCADA system and other devices, it’s possible to run a drivers’ diagnosis via “Drivers’ Diagnosis” screen, accessed via Maintenance Support System (MSS). On this screen, the user can select the desired I/O driver, and monitor its statistic data and communication status in real time.
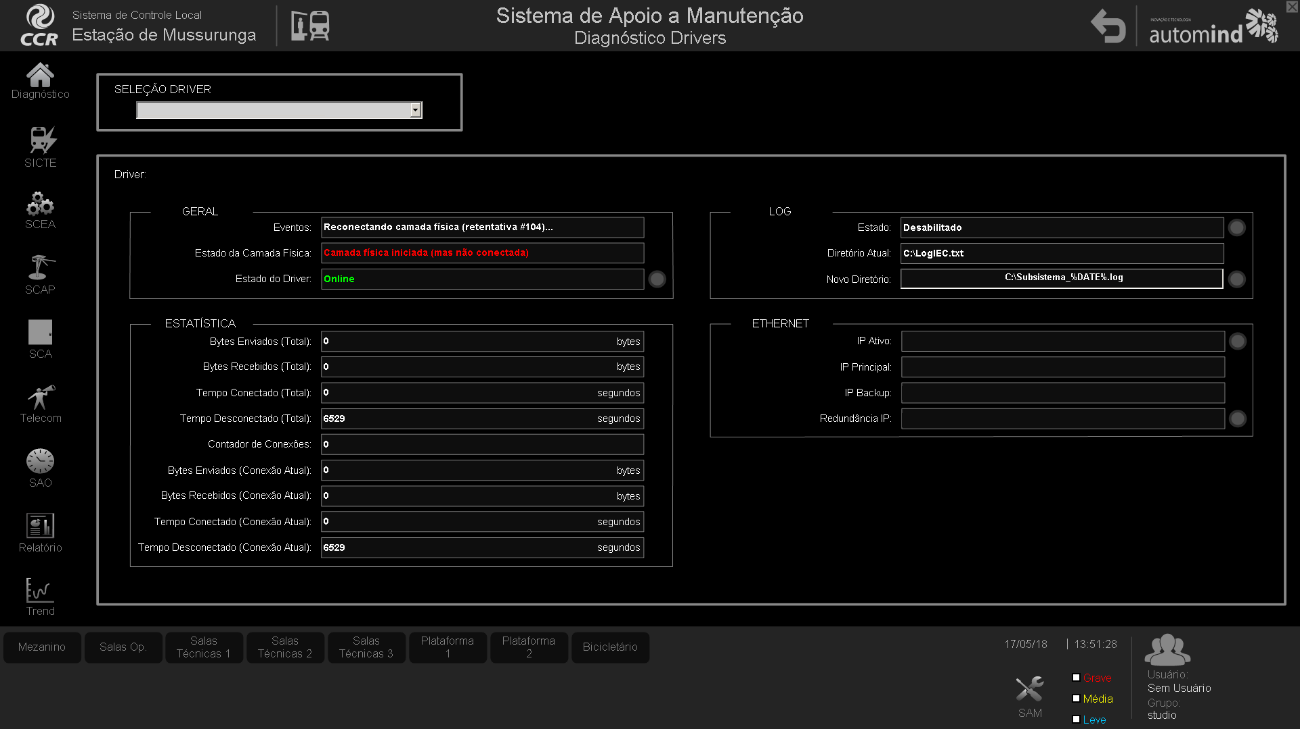
Figure 6 – I/O Drivers’ Diagnosis
Alarms/Events Management
The alarms screen displays a summary of all alarms existing in the application. It’s possible to apply filters to it by area/device, station (in the OCC’s operation), and severity (high, medium, or low). In addition to these filters, it’s also possible to acknowledge the alarms. The alarms summary, on the bottom half of the screen, only displays the station’s alarms, which can be filtered by severity.
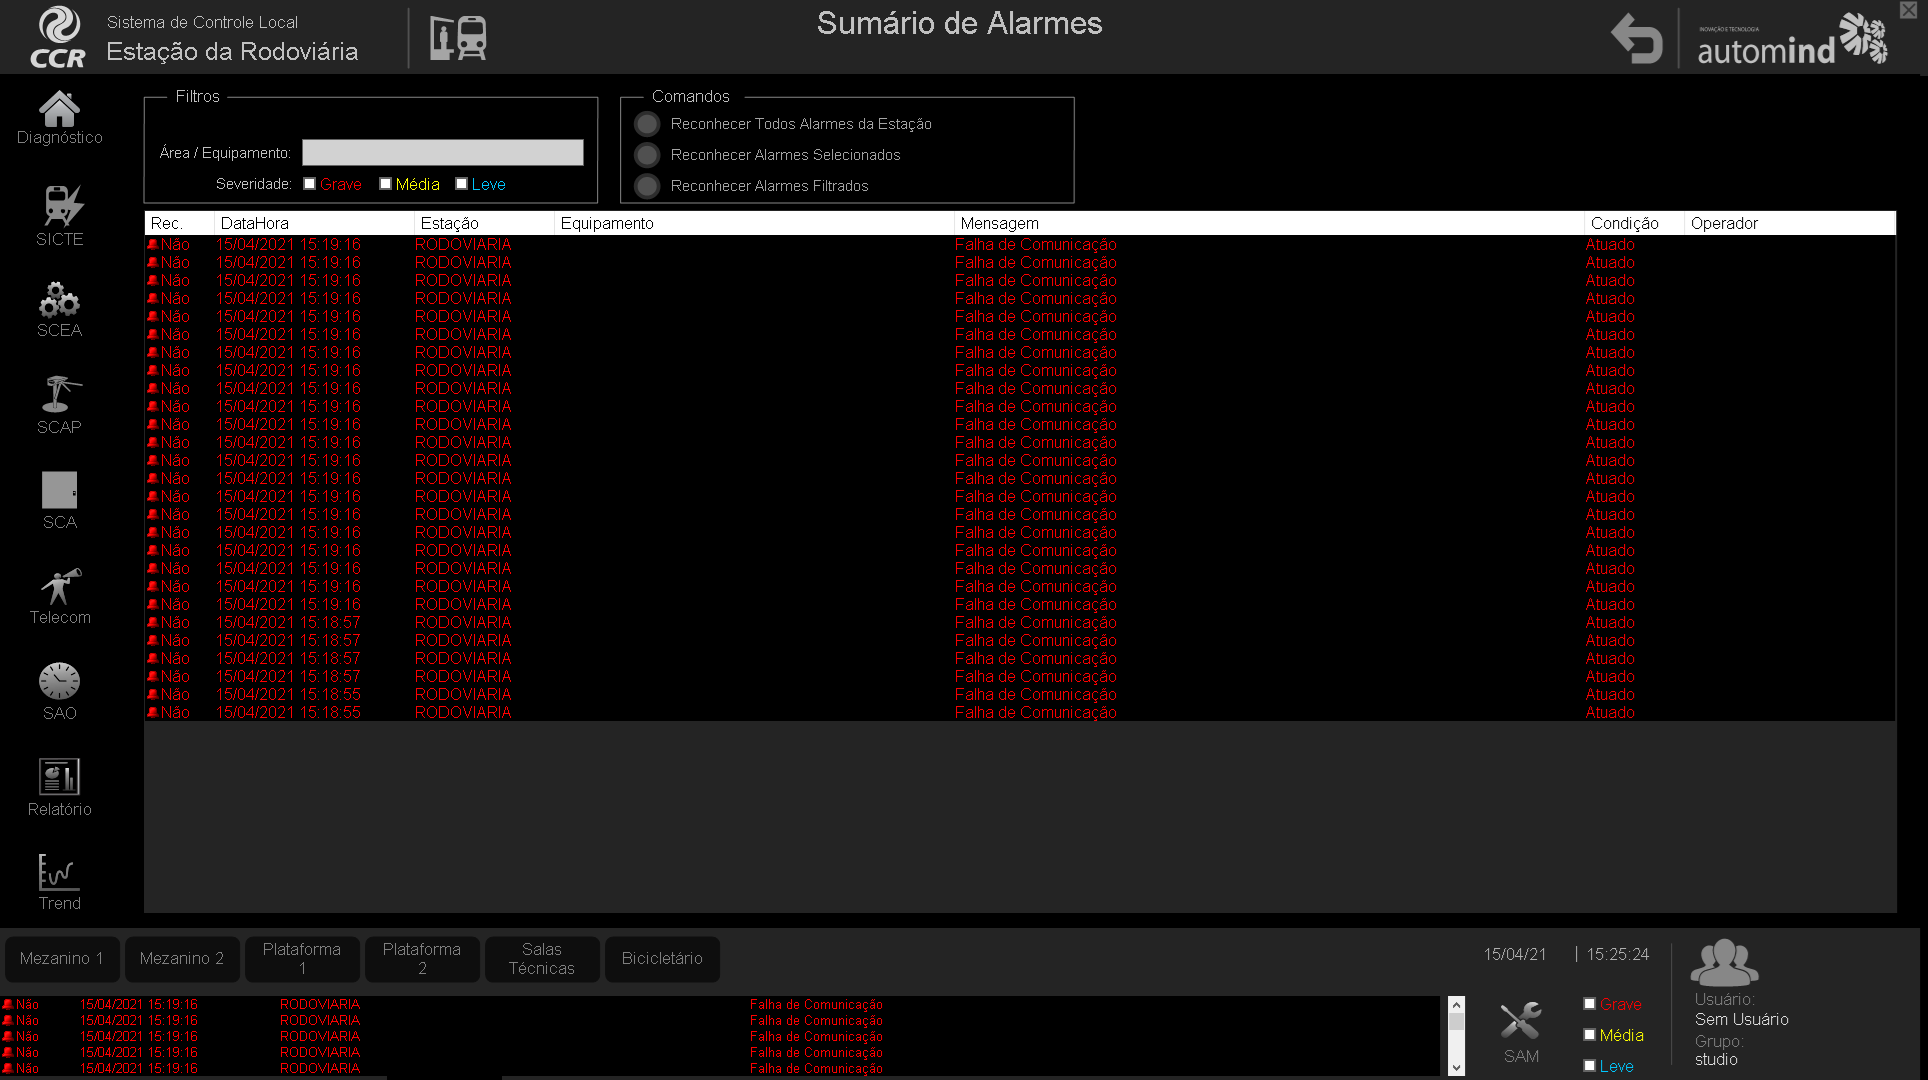
Figure 7 – Alarms summary
Reports of Alarms and Historic Events
The reports screen displays all alarms and events in the application that have taken place since the system started recording this data. Its goal is to show all possible changes in status of each alarm/event, thus keeping a record of these situations for further analyses.
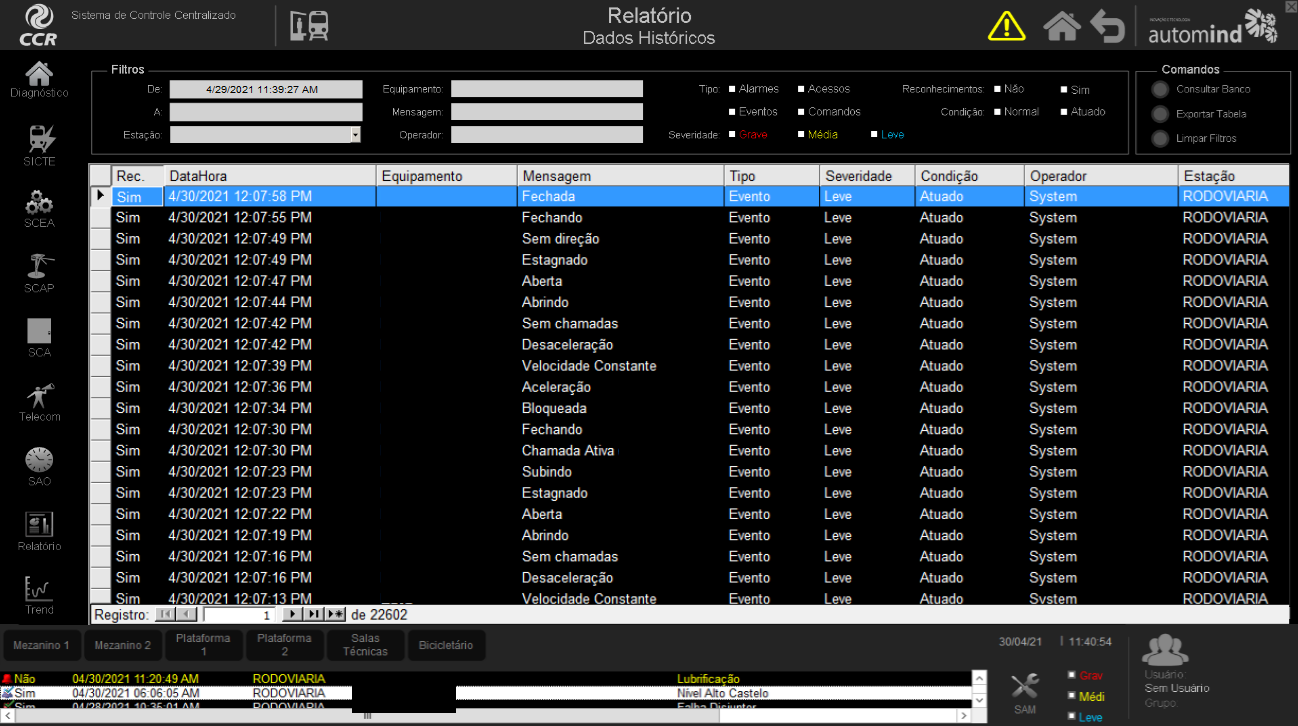
Figure 8 – Reports of Alarms and Historic Events
Operational Automation System (OAS)
OAS screens allow creating and editing activity routines for several devices. The main screen displays a list with all existing routines and allow adding new ones to it. It also allows editing/removing/enabling/disabling previously created routines.
When communication fails, there may be issues to updating routines in the SCADA redundant server where they are saved. For that purpose, there is a button on the upper right side of the screen that forces these updates. The status of the most recent update for both servers is described in a text box next to this button.
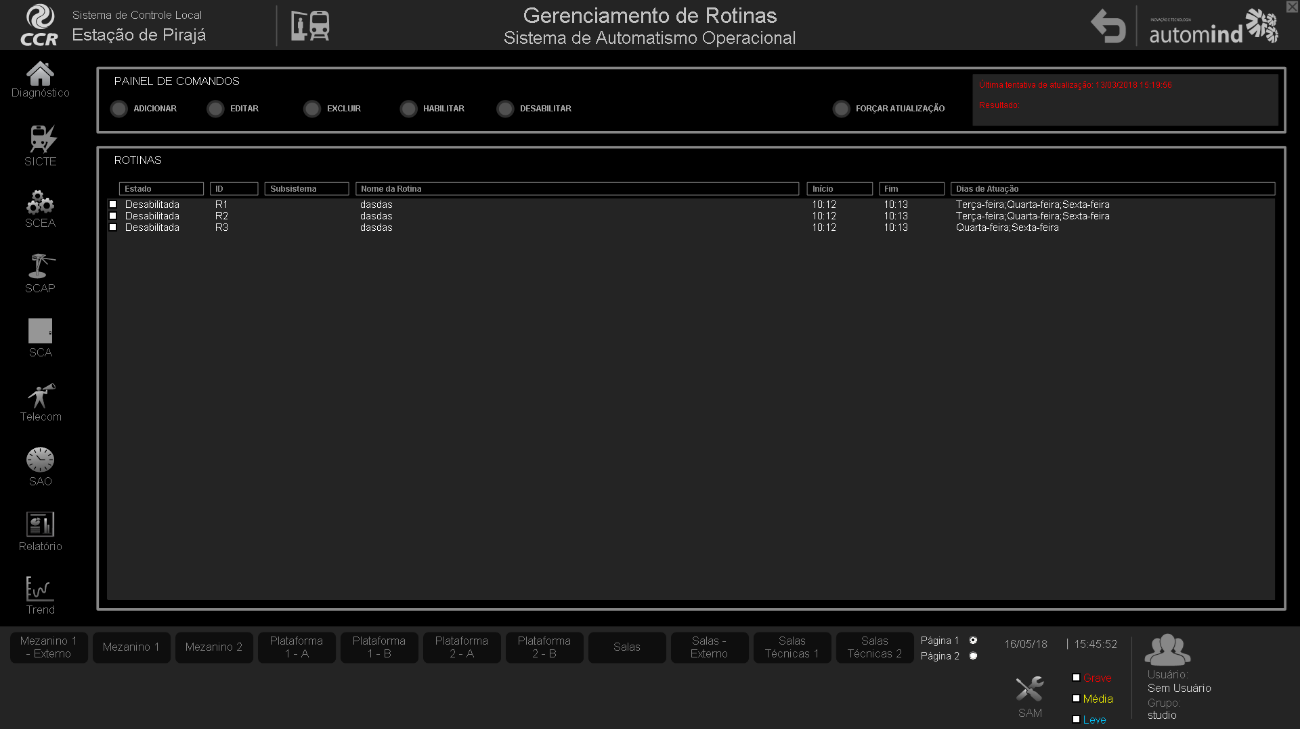
Figure 9 – Operational Automation System
When editing “Cause”, the operator can choose between “scheduled event” or “expression event”. If they choose a “scheduled event”, the routine will always take place in the same day and at the same time it was set up, and no expression will need to be configured. If they choose an “expression event”, in addition to time and date, the event must also meet the expression’s requirements in order to be executed. When editing “Effect”, the operator will configure the actions that the routine will execute.
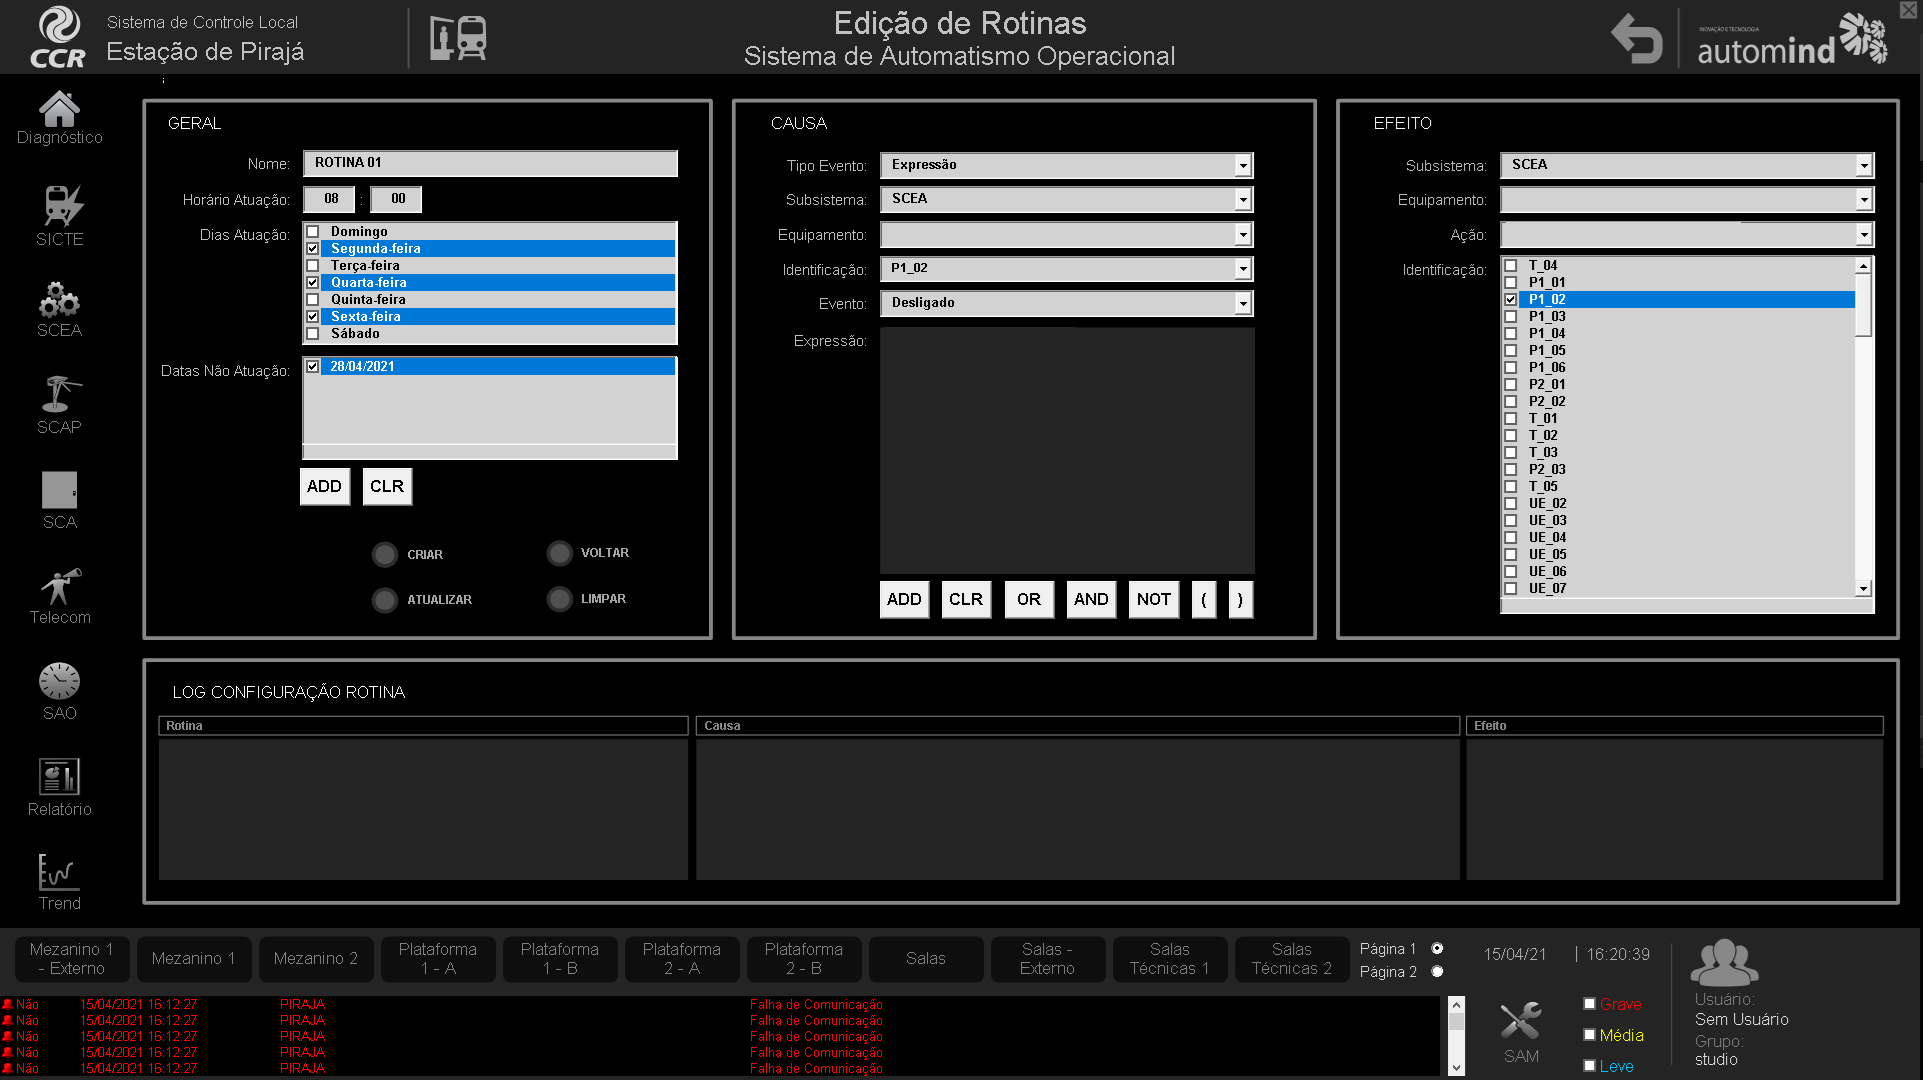
Figure 10 – OAS – Editing routines
Transferring commands between OCC and OSR
In some subsystems, commands can be issued either via OCC or OSR, so managing command priority is a possibility. The text (“OCC” or “OSR”) indicates which one has enabled the command. Because the OCC has the priority in system operation, whenever it issues a request, the subsystem’s control is automatically granted to the OCC.
When an OSR issues a request, however, the matter of priority is handled differently. When executing the request command, a window pops up in the OSR application asking whether the transfer should wait for the OCC’s permission (within a certain amount of time) or not (in case of emergencies).
Figure 11 – Transferring commands
Energy and Traffic Substation
This subsystem supplies the SCADA system with states, diagnoses, and commands for electric substations, QGBTs, QGMTs, low voltage generators, rectifiers, inverters, QDCAs, and PCSVs. You should notice that the OSRs in this application either run on Elipse E3 or Elipse Power, depending on the station.
Ancillary Devices’ Control Subsystem (ADCS)
This subsystem supplies the SCADA system with states, diagnoses, and commands for monitoring and controlling pumps, escalators, elevators, tech rooms’ temperature, FDAS, air conditioning units, switchboards, and emergency doors.
Fire Detection and Alarms System (FDAS)
This subsystem tracks the performance of the substations’ fire detectors and supplies this data to the SCADA system. The main goal of this subsystem is to monitor any fire outbreaks in strategic points in the stations in order to protect metro users. If any smoke/fire source is detected, the SCADA system (Elipse E3 or Elipse Power) will turn on an icon on screen representing a detector.
Cooling
This subsystem supplies the SCADA system with analog read, states, and diagnoses of evaporators and precision conditioners. It also executes operational commands. The main function in this subsystem is to monitor the evaporators operation. The SCADA software (Elipse E3 or Elipse Power) displays an icon on screen representing the evaporators in green (ON) or red (OFF).
Electronic Monitoring System (EMS)
This subsystem supplies the SCADA system with the images transmitted via monitoring cameras by CCTV (Closed Circuit TV) in the metro stations. The SCADA software (Elipse E3 or Elipse Power) displays an icon on screen representing the camera in red whenever there is a communication failure.
Mobile Communication System (MCS)
Integrating this system to the SCADA system allows accessing the information pertaining to the states of repeater stations, channels in use, failures, and alarms from mobile communication devices (radios). The SCADA software (Elipse E3 or Elipse Power) displays an icon on screen representing the server in red whenever there is a communication error and in green otherwise.
Access Control System (ACS)
Integrating this system to the SCADA system allows detecting or activating doors (open, block, unblock) to restricted areas in the SMSL area. The SCADA software (Elipse E3 or Elipse Power) displays an icon on screen representing the door in red (alarm), white (communication failure), or green (no issues).
Multimedia System (MMS)
Integrating this system to the SCADA system allows monitoring 10 multimedia panels in the stations (sound, chronometry, signboards), which in turn will allow sending video and audio messages to the public via the SCADA software installed in the OSR (Elipse E3 or Elipse Power).
Main Ventilation System (MVS)
The goal of the Main Ventilation System is to control ventilation at stations and on tunnels. The SCADA system (Elipse E3 or Elipse Power) will send commands that turn ventilation devices on or off, as well as monitor states and failures in the subsystem.
Intercoms system
This system, integrated to SCADA, allows supervising and controlling the entrance of vehicles in restricted areas at SMSL (Salvador and Lauro de Freitas Metro System).
Portable Data Terminals – PDT
The system was also developed for use in portable data terminals. These devices have no keyboard and work similarly to a tablet. Their layout is different from the ones in the OCC and OSRs, but the functionalities are the same. They are used mainly by the maintenance team.
Figure 12 – PDT main screen
PIMS – Elipse Plant Manager
The automation system has a built-in PIMS (Plant Information Management System), called Elipse Plant Manager (EPM). It is used by the maintenance crew for acquisition and processing of critical subsystem data. The information generated by EPM allows spotting possible failures early and keeping a routine of improvements in the operation and maintenance of the monitored subsystems.
In addition to EPM monitoring, automated MS Excel Reports were developed to aggregate and handle the crucial information so that the maintenance staff can be more efficient when following the critical points in the system.
Benefits
- The energy system’s monitoring and command activities are currently taking place remotely, in a centralized way, at the OCC (Operations Control Center), from the SCADA system. If that wasn’t the case, the maintenance team’s FTE would necessarily need to increase significantly in order to serve all maneuvers locally in all Primary Substations, Rectifiers, and Ancillary Posts.
- The historic records of energy consumption bring crucial information to Bahia Metro System. Currently, there are data collected from field collectors kept in historics, and reports generated via Elipse Plant Management (EPM). Without this resource, it would not be possible to control energy consumption efficiently, nor it would be possible to establish goals and identify sources of waste.
- The SCADA system at Metrô-Bahia has allowed operational teams to be able to make decisions in order to anticipate major flaws from alarms and events indicated by the system. Without this resource, the number of corrective maintenance interventions and, therefore, the numbers of episodes of unavailability of services, would increase significantly.
Datasheet
Client: Grupo CCR
Solution provider: Automind Automação Industrial Ltda.
Elipse product used: Elipse E3, Elipse Power, and Elipse Plant Manager
Number of I/O points: 44,000
