Engie Brasil’s Jorge Lacerda Complex performance optimized by Elipse E3
Operation at Complex’s three plants (A, B and C), which are part of Latin America’s largest thermoelectric hub, is now safer, more dynamic, due to the Brazilian software
Needs
Located in Capivari de Baixo, in the southern tip of Brazil, the Jorge Lacerda Thermoelectric Complex comprises three plants (Plant A, Plant B, and Plant C), and is regarded as Latin America’s largest mineral coal thermoelectric hub, generating up to 857 MW. Employing technologies from different European countries, the complex is connected to the Brazilian Integrated System of Electric Energy. In addition to generating power, the complex is the largest mineral coal consumer from Santa Catarina state.
In order to modernize the SCADA system already operating at Jorge Lacerda Plant C, the client opted for installing Elipse E3, the software supervisory solution developed by Elipse Software. To do so, the first step was to replace the old system controlling the workstations; the system employed several distinct supervisory programs in Full Graphics and different routines developed in Unix and C languages.
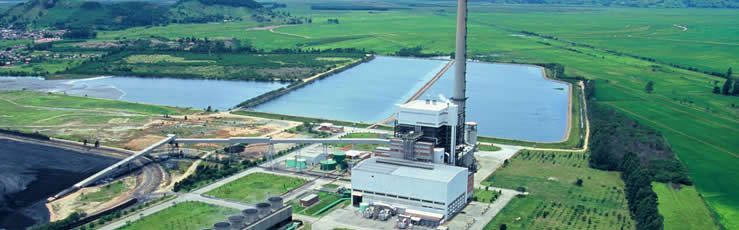
Figure 1. Jorge Lacerda Plant C
Operating the old system proved to be a daunting task due to the overabundance of variables involved in it. To work around them, Engie Brasil Energia (formerly known as Tractebel Energia) developed a new system for the plant based on Elipse E3. Unlike the old system, this one stood out for its reliability and for allowing new features to be added to the project as needed.
In 2009, Engie Brasil expanded the system to the Generating Units 3 and 4 at Plant A e to the entire Plant B. In 2012, Plant C’s application was completely reformulated; the same happened in 2014 to Plants A and B as a whole. The responsible for implementing Elipse E3 in all three plants was the Brazilian company scadaHUB.
Solution
The Jorge Lacerda Complex currently employs 10 Elipse E3 copies, which are accessed from four different places in the complex: two rooms in Plant A, one in Plant B, and one in Plant C. Plant A’s units 1 and 2 are both controlled and monitored by Elipse E3, while units 3 and 4 are only monitored by it.
Plant B comprises two generating units that are fully monitored by Elipse E3, which is also the responsible for controlling soot blowers from the boilers. Plant C is also fully monitored by Elipse E3; the software commands the substations and the process of water demineralization.
Variables related to power generation are displayed on the screen’s footer; some of these variables are: flow (from the air used for burning coal, from the steam used for moving engines, and from coal employed in the boilers), temperature, and pressure. Engine speed, power generated by each unit in the plant, events, and alarms are also displayed there.
High-severity alarms are displayed in yellow, and very high-severity alarms are displayed in red. To reinforce this control, a sound alarm is also fired whenever there is a situation in one of the plants.
Engines and Bearings
Elipse E3 allows monitoring the lubricant oil system from engines (the devices responsible for activating the plant’s energy generators) by displaying oil temperature, pressure, and pumps statuses. The vibration in bearings (the structures connecting distinct pieces in the engine) is also monitored by the software.
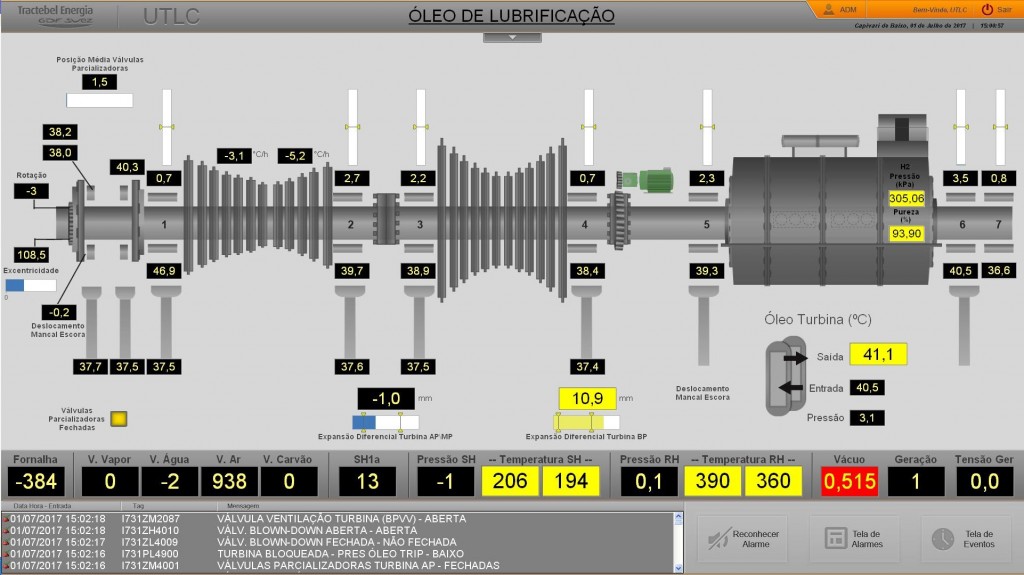
Figure 2. Engine’s oil lubrification control
Coal, Air and Gases
The whole process of coal milling, which reduces it to powder so that it can be later burned in boilers, is supervised by Elipse E3. With it, mills and other key variables for transporting the coal to the furnace are monitored.
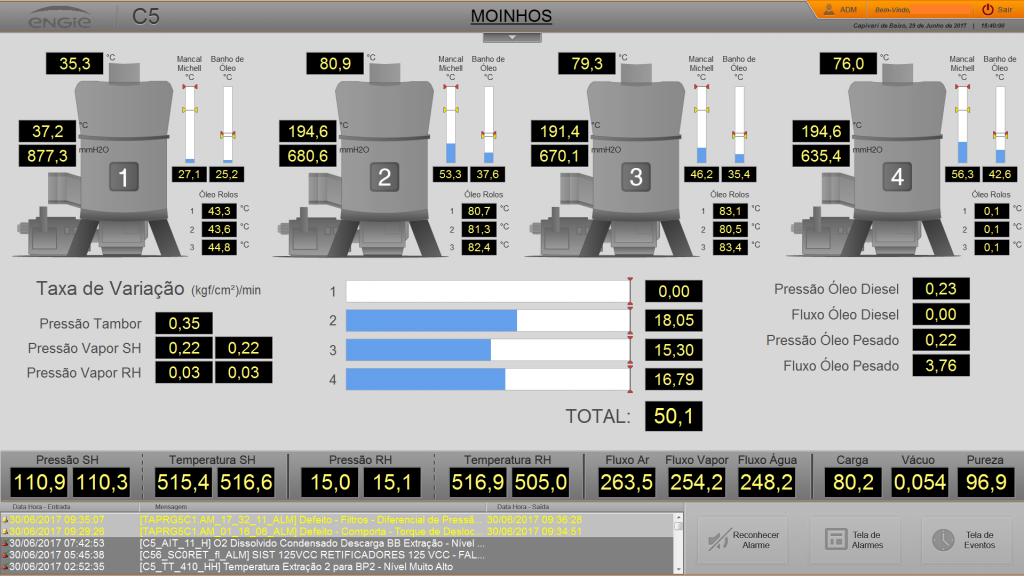
Figure 3. Coal mill control
Another screen allows operators to monitor the air let inside each plant’s boiler (where the coal is burnt) and its passage through the electrostatic precipitator. The device removes all particles in the air resulting from coal burning even before they can be expelled through the chimneys.
Alongside this process, the software allows controlling pumps, temperatures, pressure, and air flow. Additionally, it allows visualizing in a chart the amount of oxygen and carbon dioxide released after burning the coal.
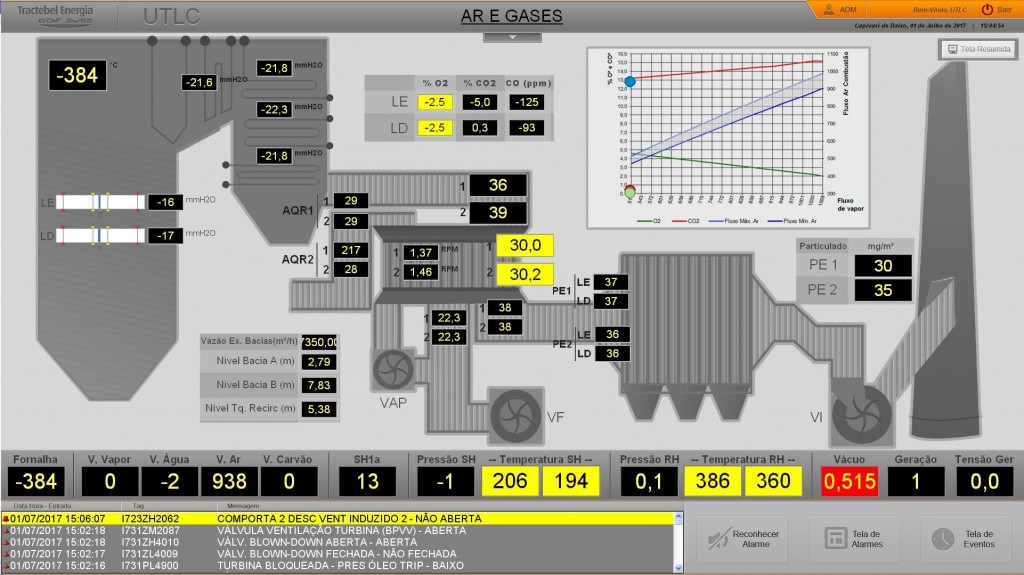
Figure 4. On the right: chart displaying the amount of O2 and CO2 released into the atmosphere
Feeding and Cooling Water
The application allows controlling how water and steam are used in the plants to generate power. First, the water is pumped into the boiler, where it will be heated, and the resulting superheated steam will move the engine, thus activating the generator and producing energy.
After that, the superheated steam will return to this condenser, where it is resent to the boiler in liquid form. Throughout the whole cycle, operators are able to supervise water temperature and the statuses of pumps and valves.
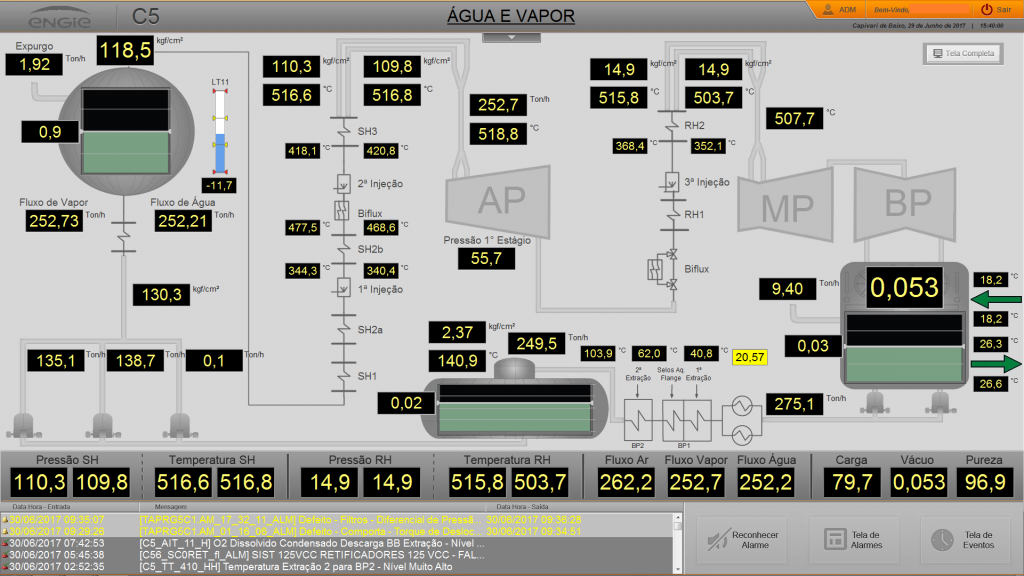
Figure 5. Water temperature control on high-, medium-, and low-pressured engines before cooling and condensing
Boilers
All the important information regarding coal burning at the boilers are monitored on a screen where water and steam temperatures, coal flow, and pressure are displayed. The system also shows the temperatures measured at boilers and barrels.
Electrical Assistants
The Elipse E3 system allows monitoring both the energy being transmitted to Eletrosul (the energy provider in the region) and the energy being used internally at the plants. For this purpose, it displays the single-line diagrams of substations, where voltage, active and reactive power output, frequency, and currents can be followed, in addition to breakers and sectionalizers comprising each plant’s electric network.
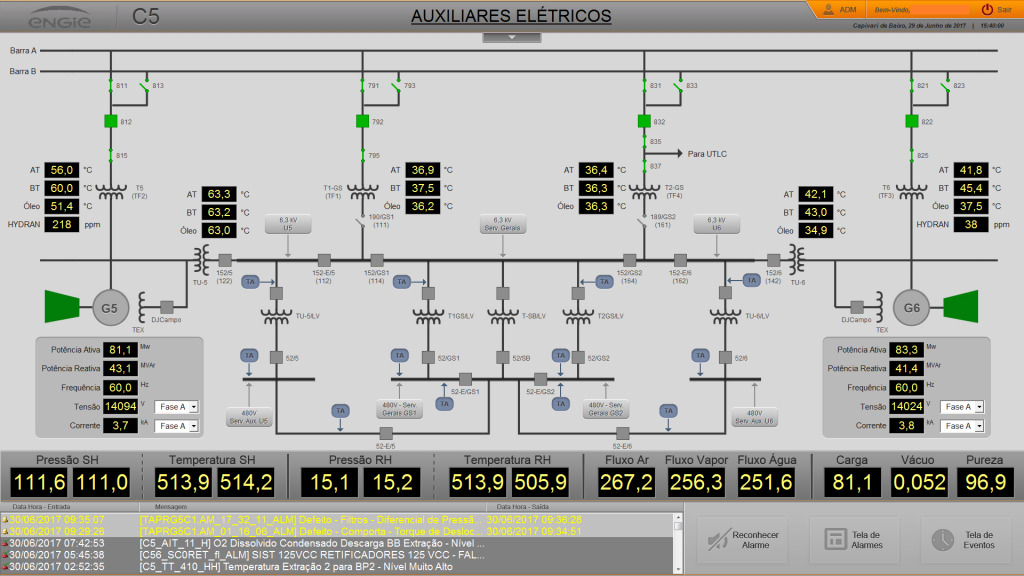
Figure 6. Electric quantities’ control
Starting the unit
Before starting the plant, the operator must evaluate whether it will work properly. For that purpose, Elipse E3 will display on a screen the information regarding water, air, steam, boilers, and engines, among other key variables and devices for this plant.
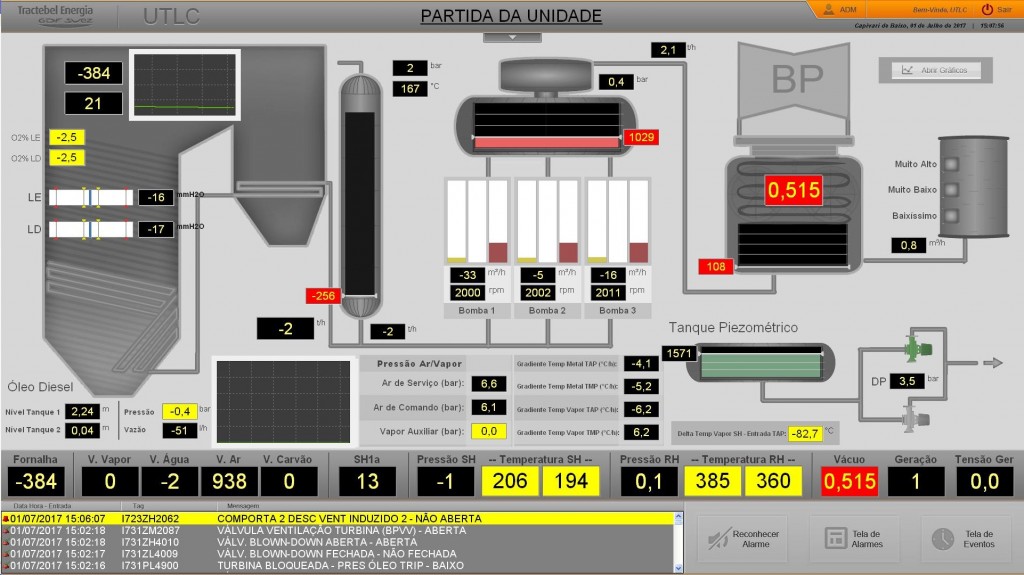
Figure 7. Controlling the plant’s start up
Trends
With its charts, Elipse E3 allows operators to evaluate whether a curve is heading to an undesired value. This type of control can be used for analyzing the behavior of several different analog variables and devices at the plant.
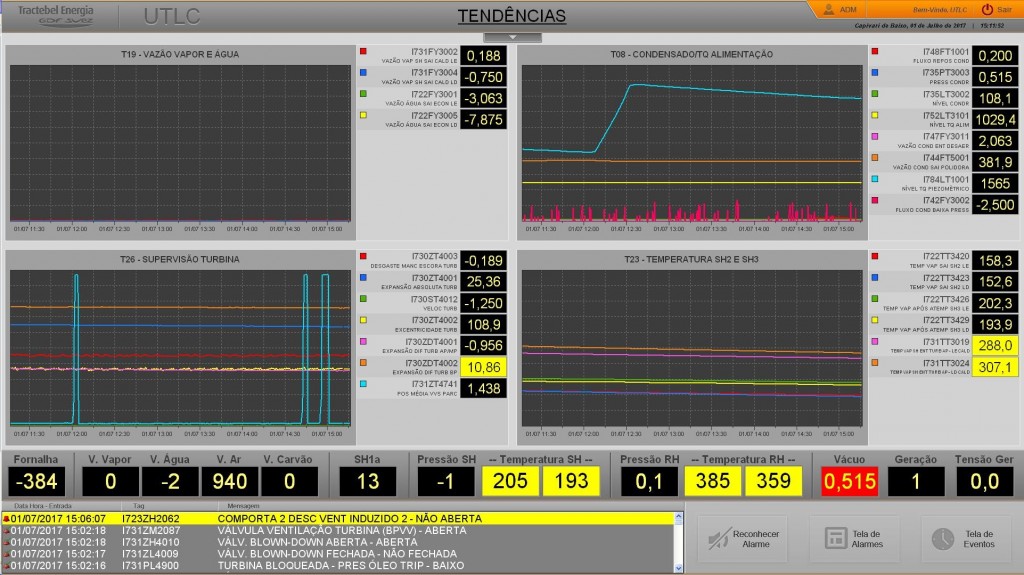
Figure 8. Trend charts
Water Demineralization
This is the process that removes mineral salts from the water in order to keep the lifespan of engines, pipes, and boilers. With Elipse E3, operators can monitor the water cycle for the entire process, from cation, anion, and mixed exchanges to its departure to tanks, so it can later be reused at boilers and engines.
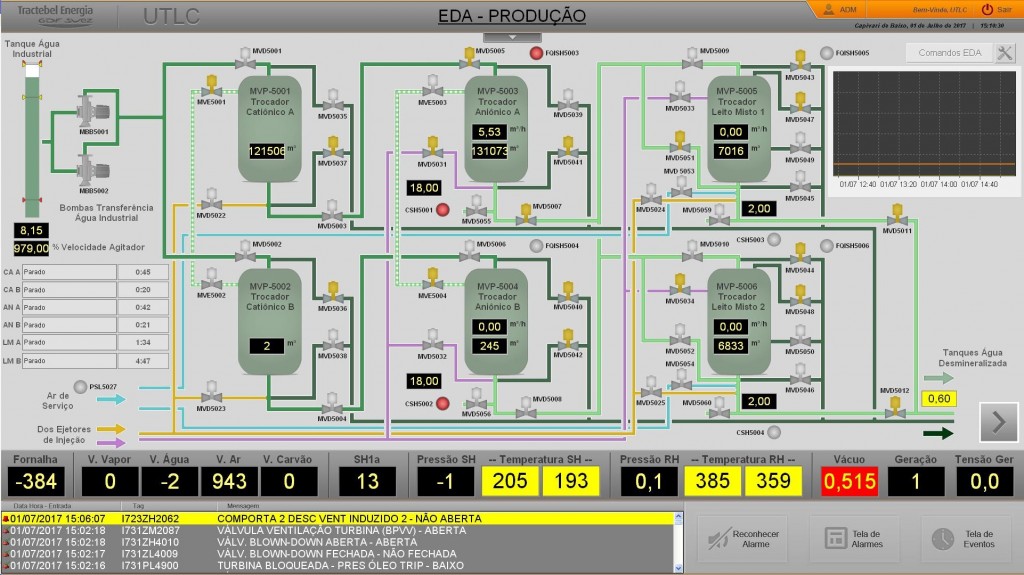
Figure 9. Water demineralization control
Benefits
According to Marcelo Bzuneck, Plant A’s head manager, some of Elipse E3’s features, such as how easily reports can be fired from operational measurement points, have been instrumental for the implementation of significant technological advances in the plant.
“Elipse E3’s friendly interface allows us to monitor several variables at once and command a great number of devices, all from a single screen, in real time. With it, we can gather the instrumental information on when the plant should be started up, or then whether a certain device has to be blocked. These are resources that have increased the system’s security as well as its operational performance,” he said.
According to Cleicio Poleto Martins, Plant B’s head manager, Elipse E3’s applications are very easily customizable to suit Engie’s needs. He also had nothing but praise for Elipse Software’s aftersales team: “They are always ready to return our demands very quickly and very clearly”.
“Full customization and their aftersales services, these are definitely the selling points of Elipse E3 for us,” he said.
Alcides Vanzzo Leonardi Netto, Engie Brasil’s Maintenance, Generation, and Sales Manager, says Elipse E3 is the best SCADA software he has ever used for his work.
“Its flexibility makes Elipse E3 the best SCADA software I have ever worked with. Another point I must add: the Elipse Software team (tech support and sales reps) is irreproachable, always going above and being to meet our every needs,” said Netto.
To Julio Renato Ribeiro Albien, Plant C’s head manager, Elipse E3 means a new era for the plant’s control: the system is now able to digitalize instrumentation to improve data storage and retrieve historical searches. The modernization of the plant’s electric system has allowed his team to check not only for supervisory but also for command functionalities for the first time.
“Not only have we designed an application that shares its language with the one used by the analog command table, but the plant is now also faster and more reliable, with better data history and associated rationales. With Elipse E3, the control system has become more agile and user-friendly to our operators,” Albien said.
Among the main benefits Elipse E3 has brought to the Jorge Lacerda Complex, we highlight the following:
- Reliable data pertaining pressure, temperature, flow, engines, bearings, boilers, pumps, valves, and other variables and devices in the plant;
- Safer failure prevention and correction with the software alarm system, which streamlines maintenance and increases system performance;
- Customized, flexible applications to suit Engie Brasil’s specific needs
- Friendlier interfaces, designed with high-performing HMI concepts, for a more dynamic operation;
- Digitalized instrumentation improves data storage and search retrieval;
- State-of-the-art electric system that allows monitoring both the energy being transmitted to the provider and the energy being used internally at the plants;
- Voltage, power, frequency, currents, breakers, and sectionalizers are monitored via single-line diagrams at the plants’ substations;
- Air quality control: the air being expelled to the atmosphere is non-polluting to the environment;
- Charts display the amount of oxygen and carbon dioxide released into the atmosphere by the plants;
- Water quality control: cooling and demineralization;
- Trend charts enable operators to visualize the plants’ variables and devices.
Datasheet
Client: Engie Brasil Energia
Systems Integrator: scadaHUB
Software: Elipse E3
Number of copies: 10
Platform: DELL Server
Number of I/O points: 49.884
I/O Drivers: DNP3 Master, SIEMENS Mprot, Modicon Modbus, OPC, and IEC 60870-5-104
